6.8.3 Ternary Contour
TernaryContour
Summary
This tutorial will show you how to create a Ternary Contour graph and to overlay a scatter plot.
Minimum Origin Version Required: 2020
What will you learn
- Create the Ternary Contour graph
- Overlay a scatter plot by drag-and-drop
- Customize the graph using the mini toolbars.
Steps
This tutorial is associated with <Origin EXE Folder>\Samples\Tutorial Data.opj.
Also, you can refer to this graph in Learning Center. (Select Help: Learning Center menu or press F11 key , and then search the keyword "Ternary Contour".)
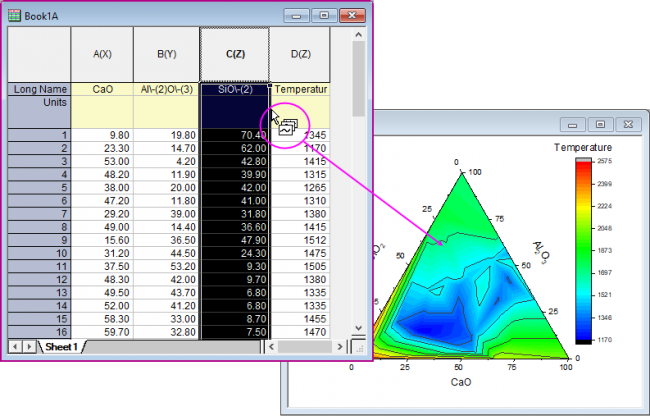
- Open Tutorial Data.opj and browse to the Ternary Contour folder in Project Explorer (PE).
- Activate Book1A, highlight the entire worksheet and select Plot > Contour: Ternary Contour to create a Ternary Contour graph. And then, we are going to overlay a scatter plot on the ternary contour graph. Click on the column header of col(C) to select it and then hover the cursor on the right border of the column. The drag&drop data icon
 will appear. Pressing the left mouse key to drag and drop this data into ternary coordinate.
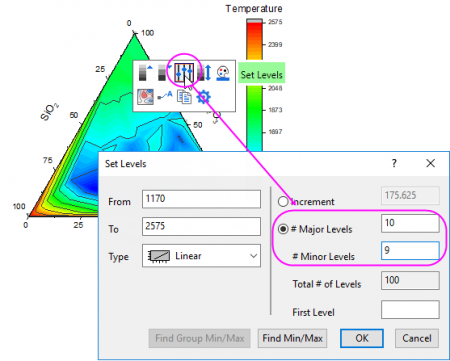
- Now we will customize the contour graph and the scatter plot. Click on the ternary contour, and in the pop-up mini toolbar, click the Set Levels button to set the Major Levels and Minor Levels as below:
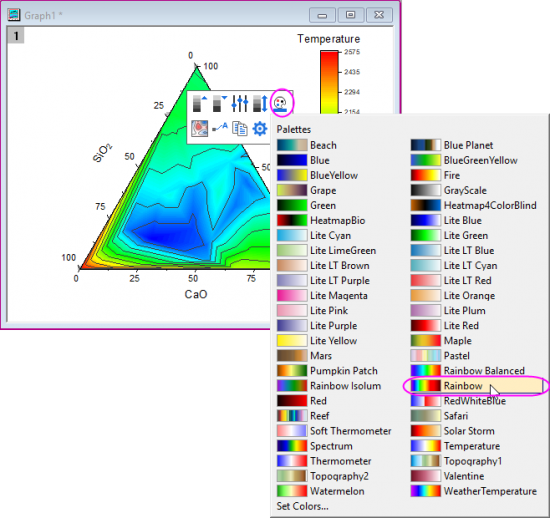
- Click OK to close the Set Levels dialog box. Click on the ternary contour again, and in the pop-up mini toolbar, click on the Palettes button to select Rainbow from the list.
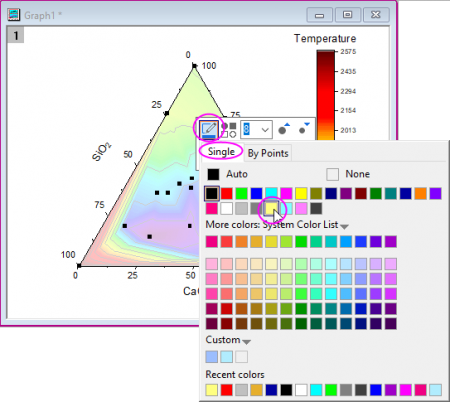
- Click on one scatter point on the graph, and in the pop-up mini toolbar, click the Symbol Edge Color button to set symbol color to LT Yellow.
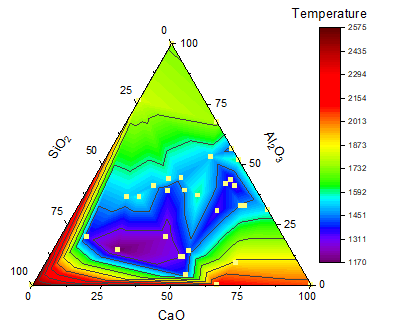
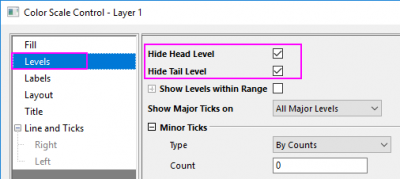
- Double-click on the color scale to open the Color Scale Control dialog. Select Levels in the left panel, check Hide Head Level and Hide Tail Level check box and click OK to close the dialog.
- The graph should now look something like this: