Stationary Test
Summary
This Stationary Test tool is supported in the Time Series Analysis App. It is used to check the stationary of a time series.
Tutorial
This tutorial uses App’s built-in sample project. To open this sample OPJU file:
- Right click the Time Series Analysis App icon
 in the Apps Gallery and choose Show Samples Folder.
 - A folder will open. Drag-and-drop the project file TSA Sample.opju into Origin.
Stationary Test
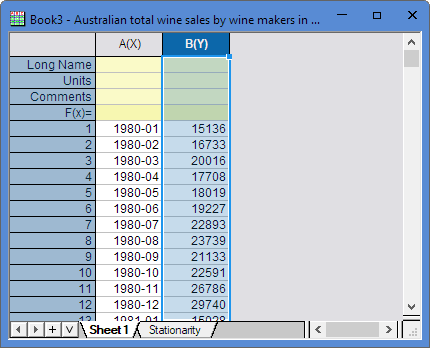
- Expand Project Explorer docked on the left. Select folder Statistics and Test . The Book3 contains data about Australian total wine sales by wine makers in bottles.
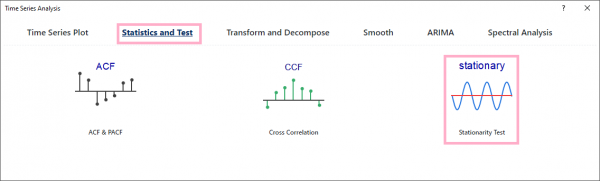
- Highlight Column B, and then click the Time Series Analysis App icon in the Apps Gallery.
- In the dialog, select Statistics and Test and Stationary Test tool.
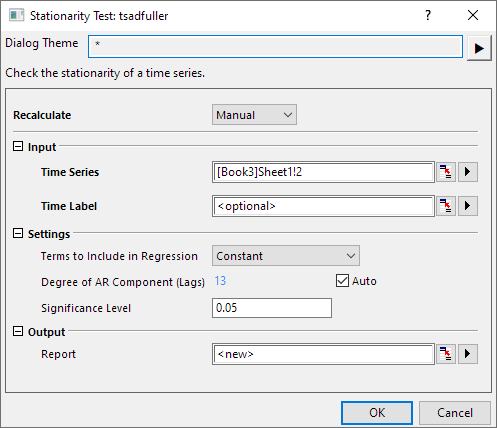
- In the dialog, set Terms to Include in Regression to Constant, click the OK button.
- Then you will get the Stationarity report.
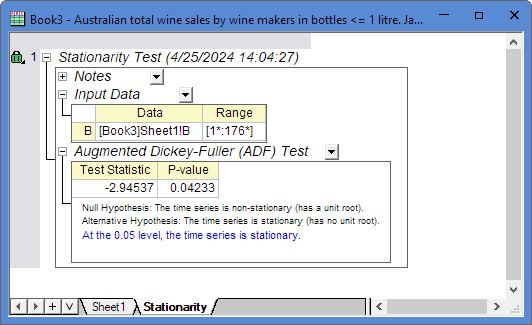 In the Augmented Dickey-Fuller (ADF) Test result table, P-value < 0.05 that means the time series dataset is stationary.
Algorithm
Stationary Test uses Augmented Dickey–Fuller (ADF) test. If the root of the characteristic equation for a time series is one then that series is said to have a unit root. Such series are nonstationary. NAG function nag_tsa_dickey_fuller_unit (g13awc) is called to calculate ADF test statistic.
The regression model

is fitted and the test statistic  constructed as

where  is the difference operator, with
  , and where
  and
and  are the least squares estimate and associated standard error for
  respectively.
To test for a unit root with drift the regression model

is fit and the test statistic  constructed as

To test for a unit root with drift and deterministic time trend the regression model

is fit and the test statistic  constructed as

An associated probability can be obtained from nag_prob_dickey_fuller_unit (g01ewc).