6.1.7 Smart Peak Labels with Leader Line
SmartLabels
Summary
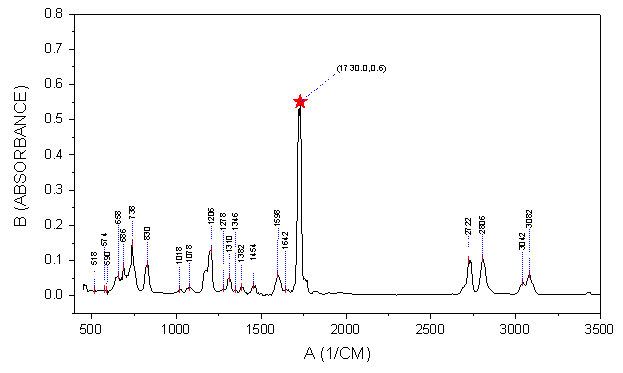
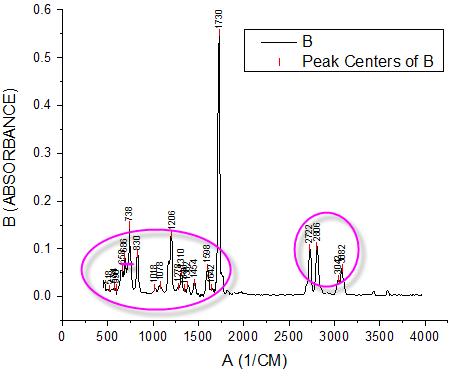
For the line/symbol plot in 2D Cartesian coordinate system, Origin supports smart labels which can be auto re-positioned to avoid overlapping. Leader lines (both straight lines and oblique lines) can be added to connect the data points and their labels.
Minimum Origin Version Required: Origin 2016 SR0
What you will learn
This tutorial will show you how to:
- Add smart labels with leader lines
- Add a special data point and customzie its label
Steps to Add Smart labels
This tutorial is associated with <Origin EXE Folder>\Samples\Tutorial Data.opj.
- Open the Tutorial Data.opj and browse to the Smart Peak Labels with Leader Line folder in the Project Explorer.
- There are two sheets in A100527IR workbook. 100-52-7-IR is an IR absorbance data and Peak_Centers1 are peak center result found by Origin's Peak Analyzer tool.
- Highlight Col(B) in sheet 100-52-7-IR to plot a line graph by selecting Plot > Basic 2D : Line menu.
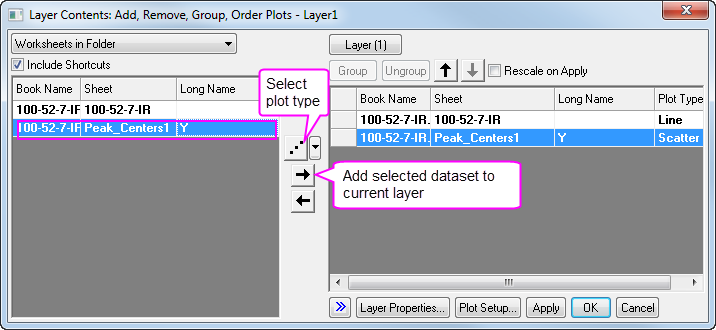
- Double click on layer 1 icon to open the Layer Contents dialog. Select col(pcy) in left panel. Click the dropdown list next to A button in the middle and select Scatter as plot type. Click -> button to add the data into the graph.
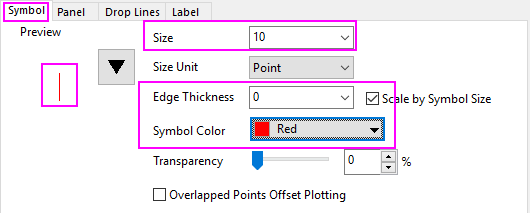
- In the Plot Details dialog, select second plot in the left panel, go to Symbol tab, do following settings:
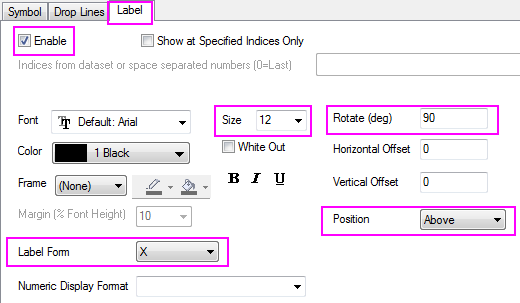
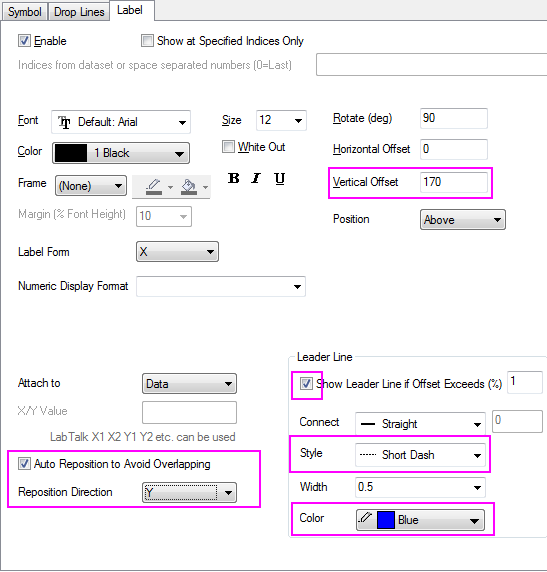
- Go to Label tab, check the Enable check box, do settings as below:
- Click on the Apply button, you will see the some labels are overlapped.
- Go back to Label tab, check the Auto Reposition to Avoid Overlapping check box, select Y for the Reposition Direction drop-down box and set the Leader Lines group as below. Also set Vertical Offset to be 170 so the leader lines are more obvious.
- Click OK button to close the dialog. You will see the labels are repositioned smartly.
Steps to Customize a Single Point and its Label
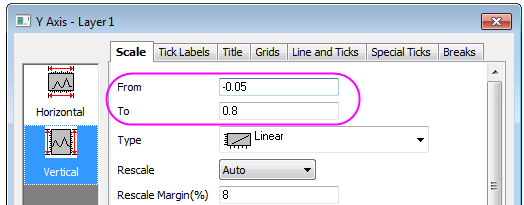
- The highest peak's label can't be seen. Double-click on the Y axis to open the Axis dialog, go to Vertical icon in Scale tab, change From and To to -0.05 and 0.8, then click OK to apply the setting.
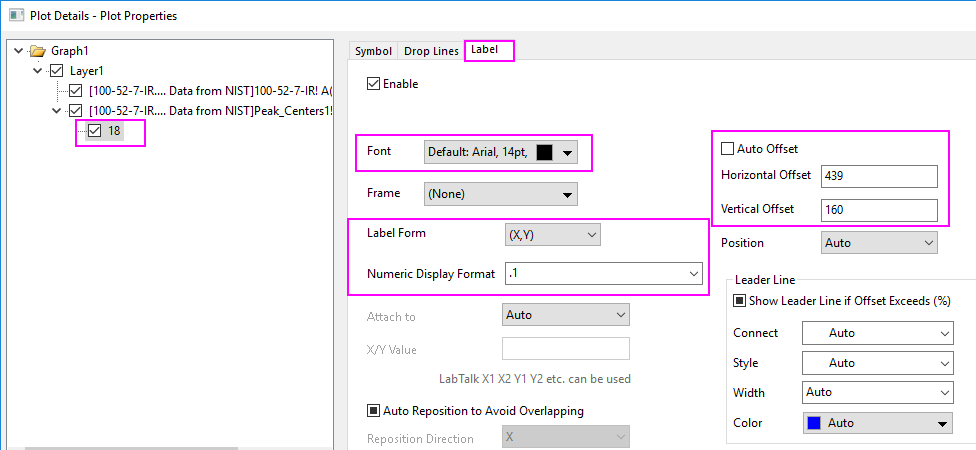
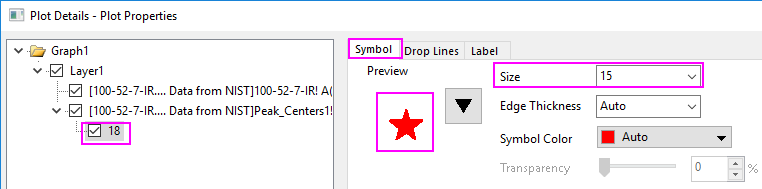
- Press CTRL key down and double click the highest peak's label 1730 to open Plot Details dialog. A node 18 shows on left panel. It's the row indexing of the special point.
- Go to Label tab of this point and customize the further.
- Go to Symbol tab to change the symbol shape and size.
More Customization Steps
The following steps can further customize the graph to be exactly the same as the image in Summary.
- Double click X axis to open Axis dialog. set From and To for X axis to be 400 and 3500.
- To show top and right frames around the graph, select Grids tab in Axis dialog. Check Opposite check box under the Additional Lines branch for both Horizontal and Vertical.
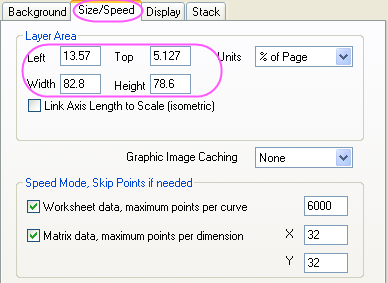
- To change the layer size, select Format: Layer... from main menu to open the Plot Details dialog. On Size/Speed tab, change the layer size in the Layer Area group as below:
- Select legend and press Delete key to delete the legend.