4.3.11 Rise Time
RiseTime
Summary
In a step-like signal, rise time refers to the time required to change from a specified low value to a specified high value (or from a specified high value to a specified low value in the case of fall time). Origin's rise time tool allows you to graphically select a rectangular area tracing a rising or falling step in the signal, and from it calculate the rise time or fall time for this selected step.
What You Will Learn
With this tutorial, you will learn how to:
- Use the Rise Time gadget tool to calculate the fall time.
- Change the settings for fall time calculation.
- Set the display elements on the graph.
- Select the desired output options and output the result to worksheet.
Steps
- Start a new workbook. Select Help: Open Folder: Sample Folder... to open the "Samples" folder. In this folder, open the Signal Processing subfolder and find the file Step Signal with Random Noise.dat. Drag-and-drop this file into the empty worksheet to import it.
-
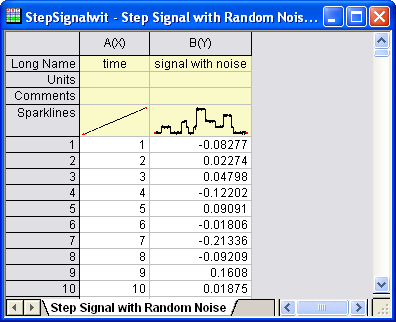
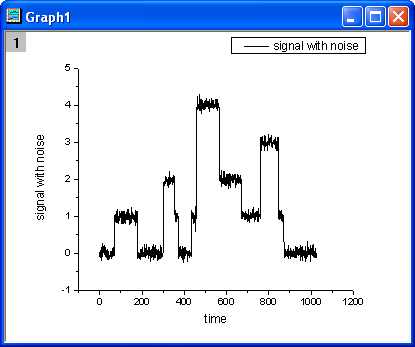
- Highlight column B and make a line plot of it by selecting Plot: Line: Line from the menu.
-
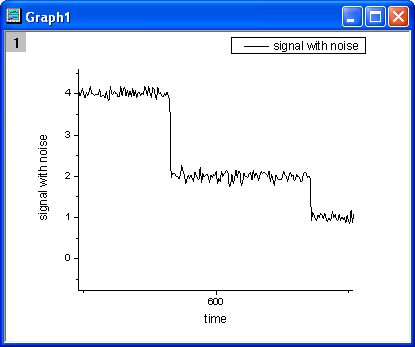
- Click the Scale In (
 ) button on the Tools toolbar, then select a range along the X axis from about 500 to 700, so that we can focus on this portion of the plot.
-
- With the graph active, choose Gadgets: Rise Time... from the menu to launch the tool.
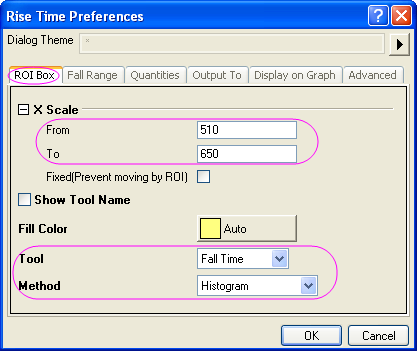
- In the dialog box, click the ROI Box tab and set X Scale From to 510 and To to 650. Set Tool to Fall Time and Method to Histogram.
-
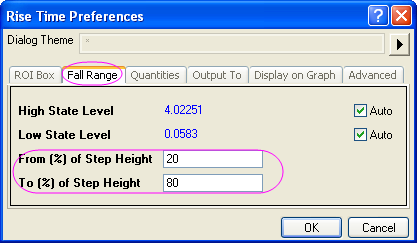
- Click the Fall Range tab and change From (%) of Step Height to 20 and To (%) of Step Height to 80.
-
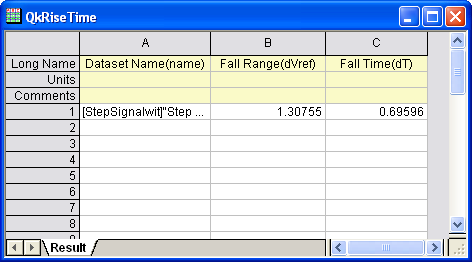
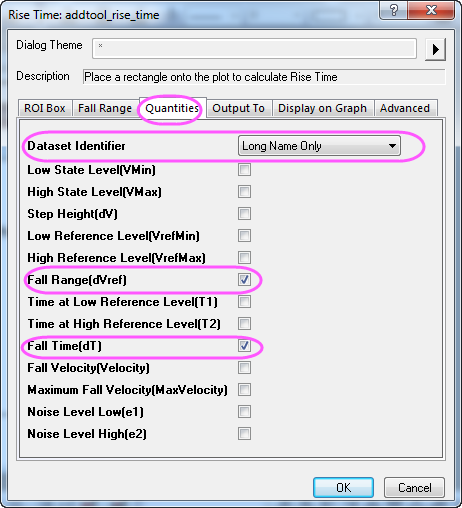
- Click the Quantities tab, check only three check boxes: Dataset Name(name), Fall Range(dVref) and Fall Time(dT).
-
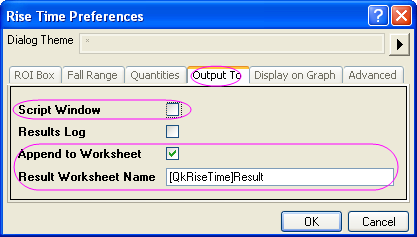
- Click the Output To tab, clear Script Window and check Append to Worksheet.
-
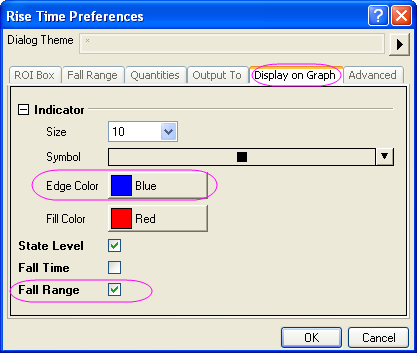
- Click the Display on Graph tab, expand the Indicator branch, and change Edge Color to Blue. Check Fall Range.
-
- Click OK to add the rectangular region-of-interest (ROI) to the graph.
-
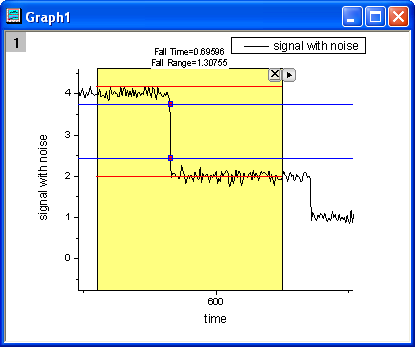
- As the above image shows, the two red horizontal lines delineate the upper level and lower level. The vertical distance between the two blue lines is the fall range, shown by the two indicator points on the line plot. At the top of the rectangle, the fall time and fall range are reported.
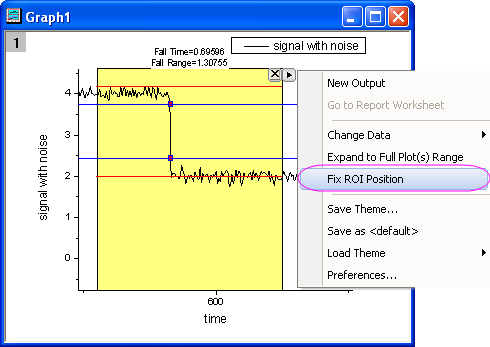
- Click on the triangle button in the upper-right corner of the ROI to open a menu and select Fix ROI Position, so that the yellow ROI rectangle is locked in place.
-
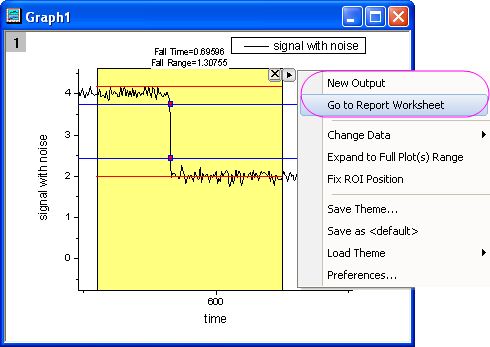
- Open the menu again and click New Output to output the results. Open the menu again and choose Go to Report Worksheet.
-
- The report worksheet is activated and we can see that the three parameters that we chose on the Quantities tab are reported.
-