4.1.9 Quick Sigmoidal Fit Gadget
Quick-SigFit-Gadget
Summary
The Quick Sigmoidal Fit gadget can be used to quickly perform a sigmoidal fit on a portion of your graph that you define interactively as your region of interest (ROI).
Minimum Origin Version Required: Origin 2015 SR0
What you will learn
- How to use the Quick Sigmoidal Fit gadget on a graph.
- How to select your fitting options.
- How to switch to the NLFit dialog.
- How to output the fitting result.
- How to find X/Y values on the fit curve.
Steps
This tutorial is associated with <Origin EXE Folder>\Samples\Tutorial Data.opj.
Quick Fit
- Open Tutorial Data.opj and browse to the Quick Sigmoidal Fit Gadget folder in Project Explorer (PE).
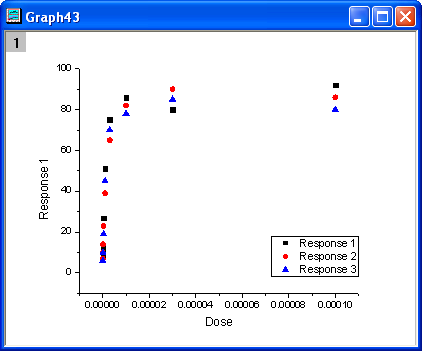
- Highlight Col(A) through Col(D) in the workbook DoseResponseN and from the menu choose Plot:Symbol:Scatter to plot a scatter graph.
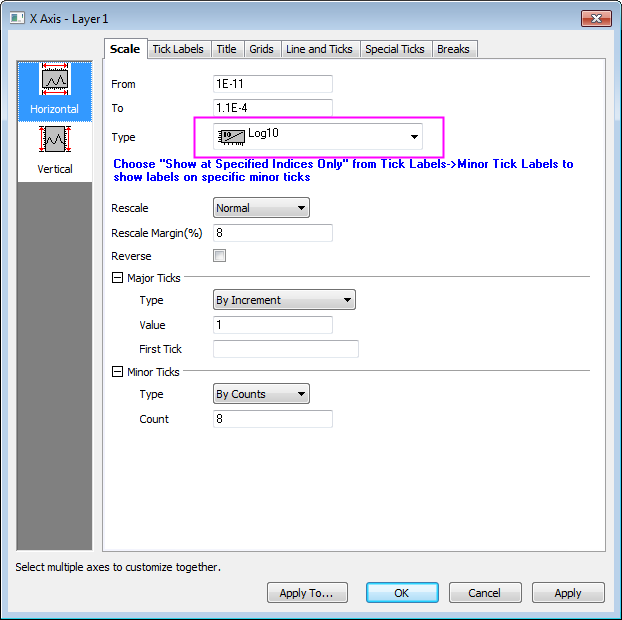
- Double-click the X axis to open Axis dialog. In the Scale tab, set the Type as Log10 and click OK button to close the dialog.
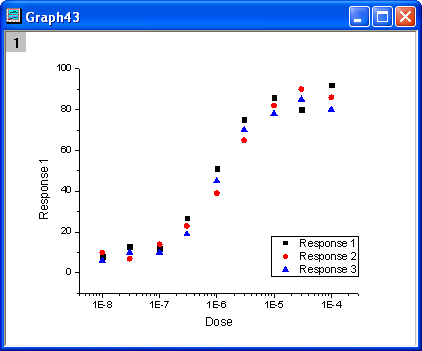
- Click the Rescale button
 to show the plot with the proper scale.
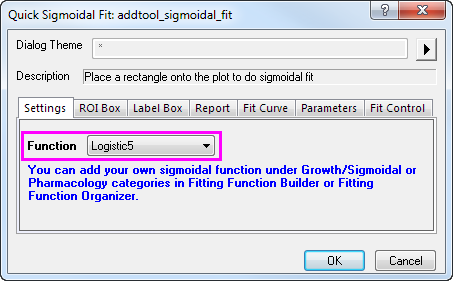
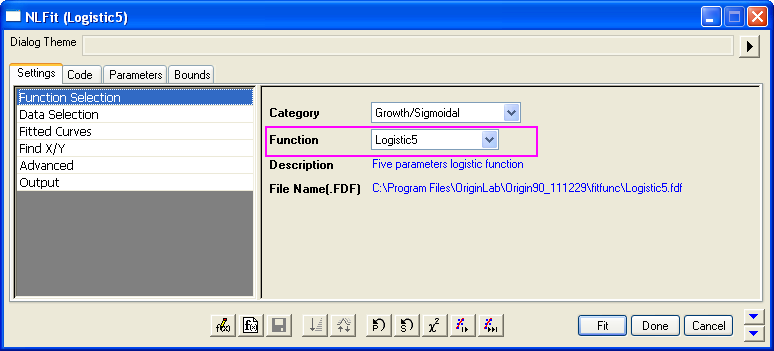
- Select Gadgets: Quick Sigmoidal Fit... from the main menu to open the addtool_sigmoidal_fit dialog box. Select the function Logistic5 from the Function drop-down list on the Settings tab.
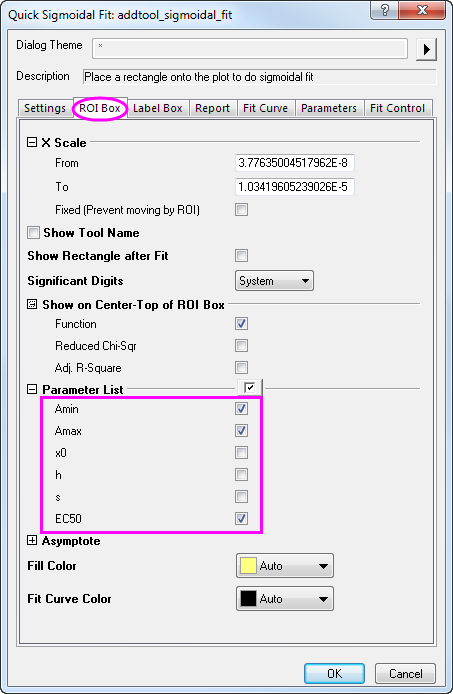
- Click the ROI Box tab and uncheck the parameters x0, h, and s under the Parameter List branch.
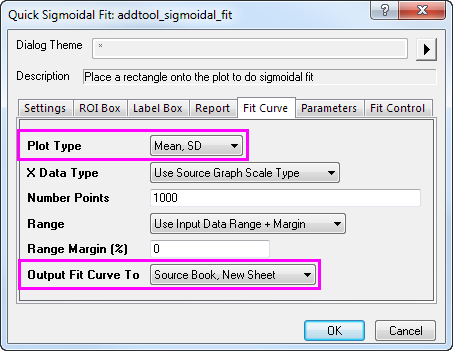
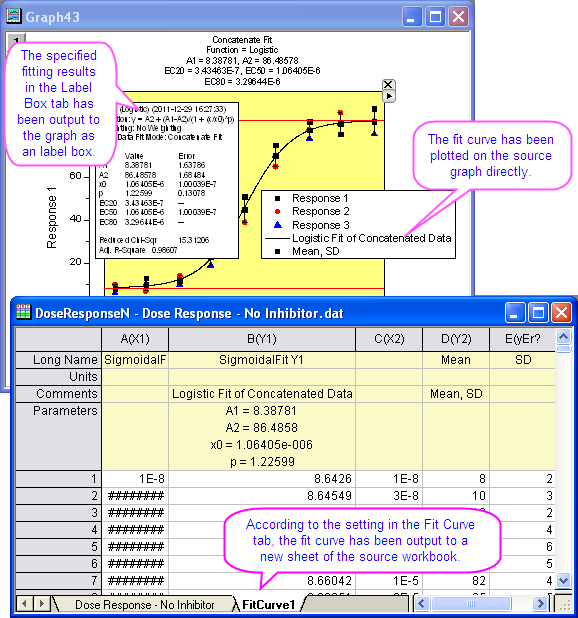
- Click the Fit Curve tab, select Mean, SD from the Plot Type drop-down list and Source Book, New Sheet from the Output Fit Curve To drop-down list.
- Click OK to add the ROI box to the graph. At the top right corner of the ROI box, click the Arrow button
 to select Expand to the Full Plots Range from the menu. The ROI box will cover the full data range on the graph.
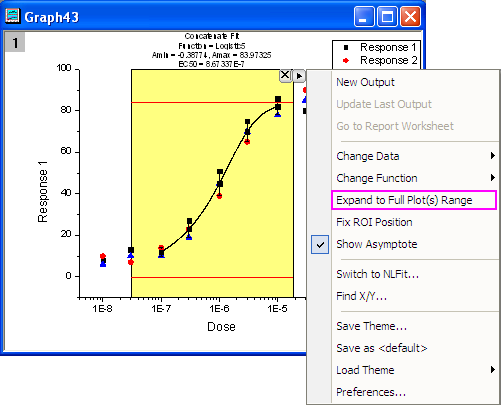
- Click the arrow button again to select Preferences... from the menu. This opens the Sigmodial Fit Preferences dialog box. In this dialog, click the Report tab and set Output To as None.

- Click OK to close the dialog box. Click the arrow button to select Change Function: Logistic and change the fitting function to Logistic. The label text on top of the ROI box will update automatically.
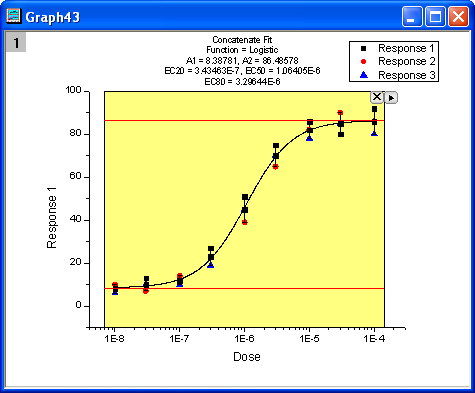
- Click the arrow button to select New Output and output the fitting result to the worksheet and graph.
Connect to NLFit
When using the Quick Sigmoidal Fit gadget you can easily switch to the NLFit tool. This makes it easy to get a detailed fit report using the current fitting settings in the gadget.
- Redo step 1 through step 8 as shown above.
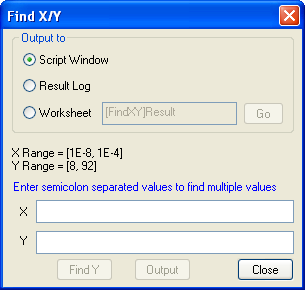
- Click the arrow button to select Switch to NLFit... to open the NLFit dialog with the inherited settings.
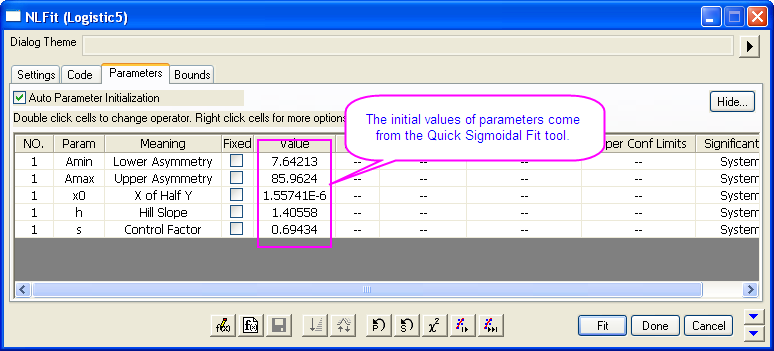
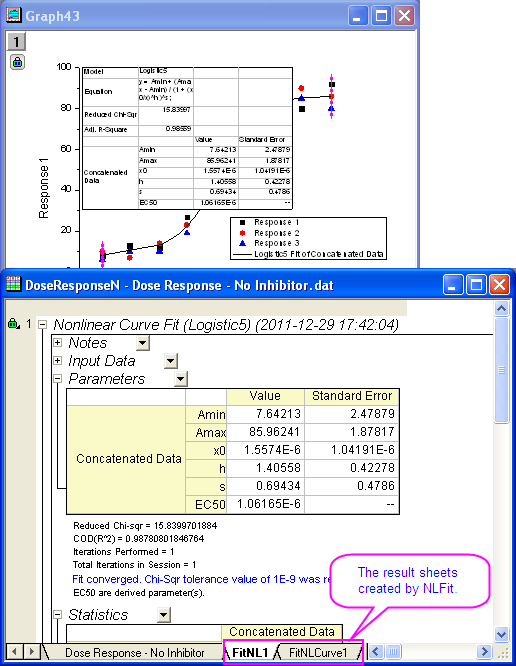
- Click the Fit button to perform curve fitting. The results are output to the result sheets and the source graph.
Find X/Y
With his gadget you can also quickly find X/Y values on the fitted curve.
- Redo step 1 through step 8 as shown in the first section.
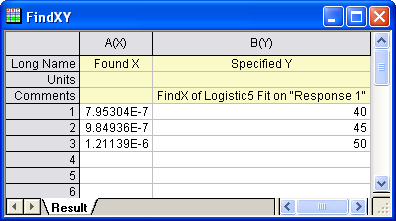
- Click the arrow button to select Find X/Y... from the menu to open the Find X/Y dialog.
- Select the Worksheet radio box and enter 40;45;50 for Y, then click Find X to show the corresponding X values in the empty X box. Then, click the Output button and the X and Y values are output to the specified worksheet.
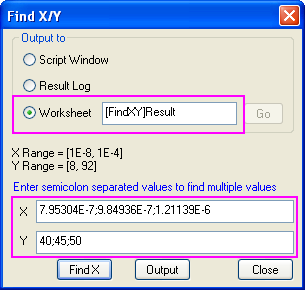
- Click the Go button beside the Worksheet radio box to open the Find X/Y workbook. Click the Close button to close the Find X/Y dialog.