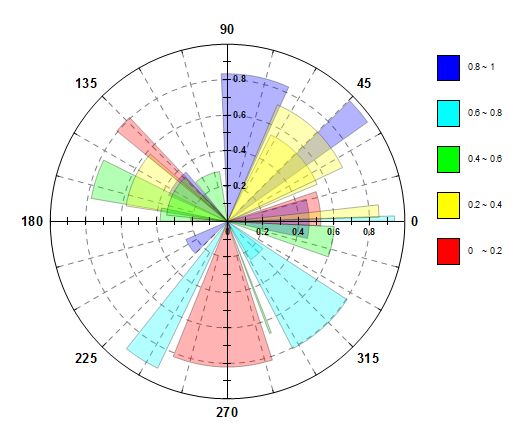
6.11.6 Polar Graph with Columns
polar-with-column
Summary
By default, Origin polar graphs are line plots. Note, however, that you can convert an existing polar line plot to column/bars.
What You Will Learn
This tutorial will show you how to:
- plot polar graphs with columns
- control the column width using a dataset
- customize the polar axes
Steps
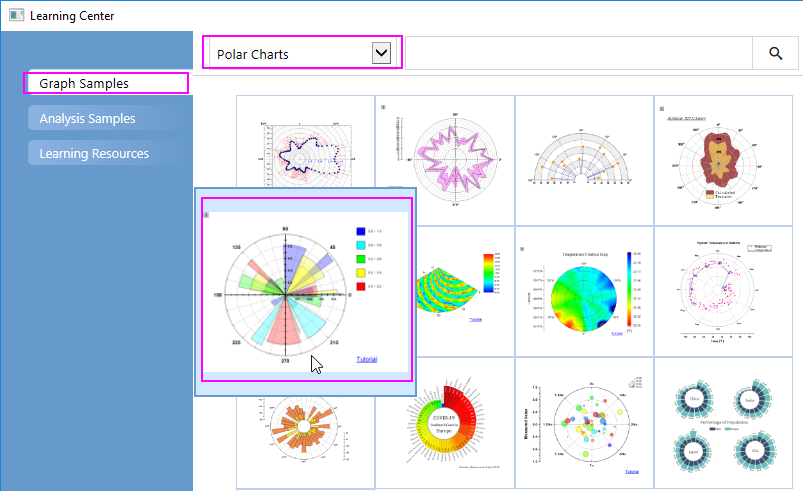
- Select Help: Learning Center menu or press F11 key to open Learning Center. Select Graph Sample tab and then select Polar Charts from the "Category" drop-down list. Double-click on the graph sample below to open the sample "Polar Chart - Polar Column with Transparency".
Note: This tutorial is associated with the folder Column and Stack Column of the "Tutorial Data" project:<Origin EXE Folder>\Samples\Tutorial Data.opj.
- Activate the workbook "Book18". Highlight column B and select Plot > Specialized:Polar theta(X) r(Y) to create a line plot in the polar coordinate system. Click on the legend object and delete it from the graph.
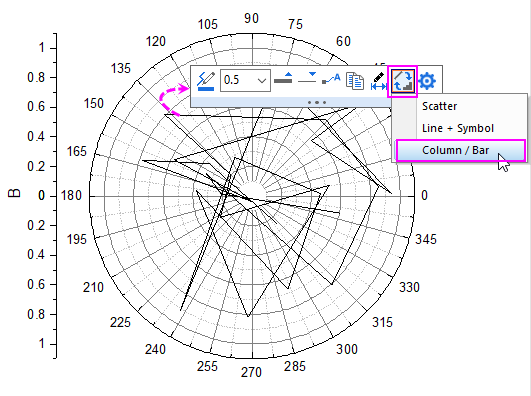
- Click on the line plot, and in the popup mini toolbar, click Change Plot to button
 to change the line plot as a column plot.
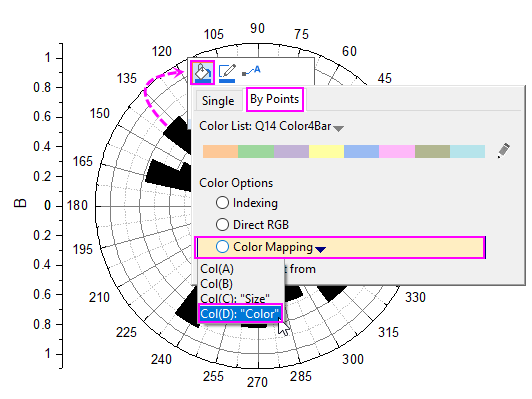
- Click on the column, and in the popup mini toolbar, click Fill Color button
 to expand the Color Chooser. In Color Chooser, select By Points sub-tab, set Color to Color Mapping:Col(D). This will map column colors in the plot using the row value in column D of the worksheet.
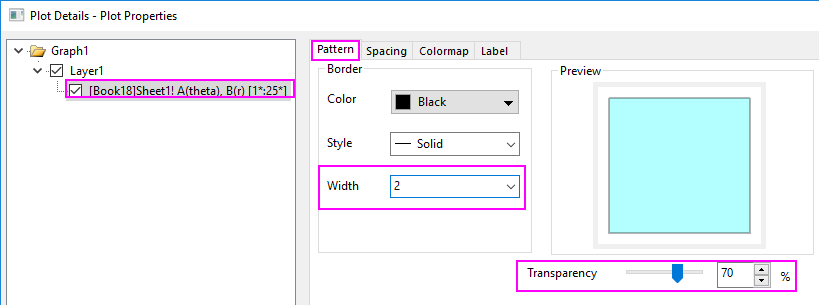
- Double-click on the column to open the Plot Details dialog.
- Go to Pattern tab, set the Transparency in this tab to 70%, and Width of border to 2 :
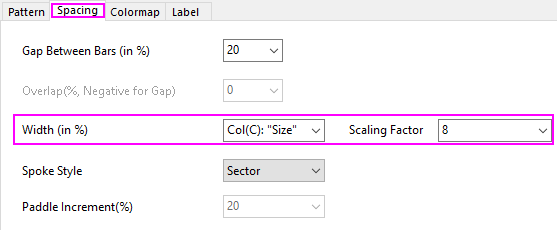
- Go to the Spacing tab, select Col(C):"Size" from the Width(in %) drop-down menu and type in 8 as Scaling Factor. This causes values in column C to determine the width of the columns in the plot.
- Go to Colormap tab, click Level head. Set the level from 0 to 1 and Increment to 0.2 in the Set Levels dialog,
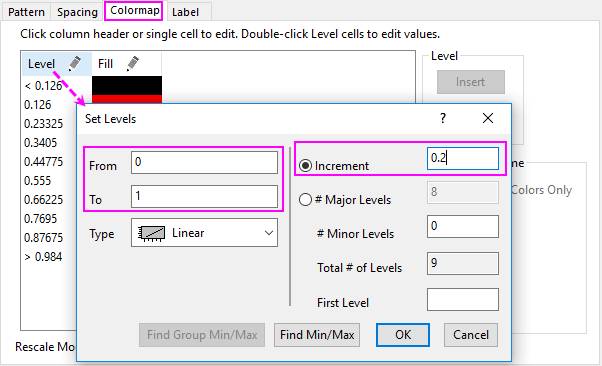
Click OK to close the Plot Details dialog.
- Now we will customize the graph Angular Axes.
- Double-click on an axis (Angular or Radial) to open the Axis dialog. Go to the Scale tab under the Angular tree node and set the Value under Major Ticks to 45, and set the Count under Minor Ticks to 2.
- Go to Format tab under Tick Labels tab of Angular -Outer tree node. Check Bold check-box.
- Go to Grids tab under Angular tree node. Change Style of Major Grid Lines to Dash.
- Go to Line and Ticks tab under Angular -Outer tree node. Change Thickness of Line to 1.5.
- In the Axis dialog, we also can customize the Radial Axes for this polar graph.
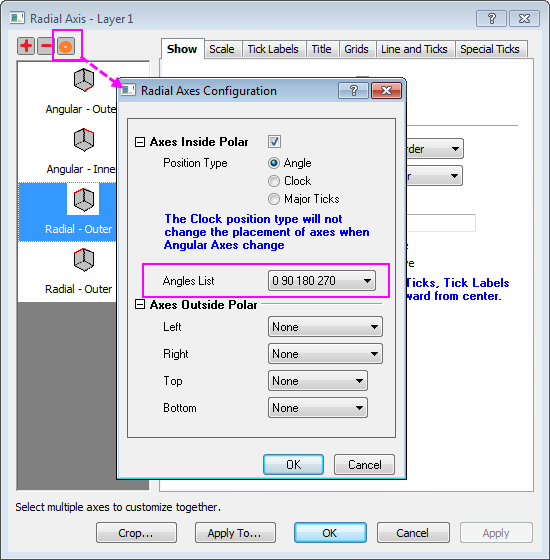
- Click on the Radial Axes Configuration button
 on the right-top of this dialog to open the dialog. In the dialog, choose 0 90 180 270 under the Angles List drop-down list.
- Go to the Scale tab under the Radial tree node. Set scale from 0 to 1.
- Go to the Format tab under Tick Labels tab, and then
- select the Radial - Inner1, change Size to 12, check Bold box, and set Rotate (deg.) to 0.
- select the Radial - Inner2, change Size to 12, and check Bold box.
- select both Radial - Inner3 and Radial - Inner4, then uncheck Show.
- Go to the Display tab under Tick Labels tab of Radial - Inner1 tree node. Choose Custom in Display drop-down list, and enter .2* in Custom Format text box.
- Go to the Title tab and highlight all radial axes node. Uncheck Show check box.
- Go to the Grids tab under Radial tree node. Uncheck Show check box under Minor Grid Lines. Click OK to save the setting and close the dialog.
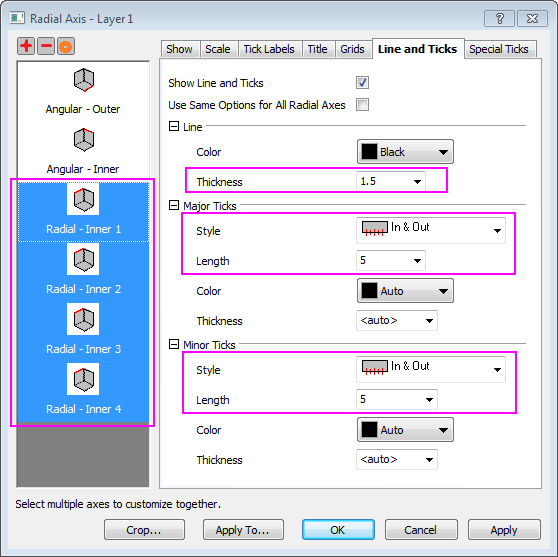
- Go to Line and Ticks tab, select all radial axes. Change Thickness of Line to 1.5. And set Style to In & Out, Length to 5 for both Major Ticks and Minor Ticks.
- Go to Special Ticks tab of Radial - Inner 1, then set Axis Begin value to Show, Axis End value to Hide. Choose Radial-Inner 2, set both Axis Begin and Axis End value to Hide. Click OK to apply the setting and close the dialog.
- Select Insert: Color Scale to add the color scale legend. To customize the color scale legend, click on the color scale, and in the popup mini toolbar,
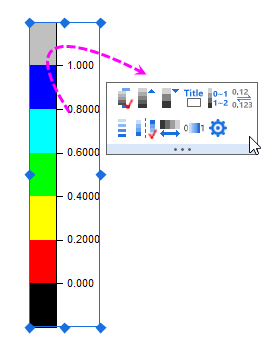
- Click Show Head and Tail Levels button
 to hide the head and tail level.
- Click Decimal Places button
 to select 1 from the drop-down list to set the decimal place of the lables to be 1.
- Click Separate Layout button
 to show the color blocks separately.
- Click on the Enable/Disable Anti-Aliasing button
 . This polar column plot should look something like this: