6.11.2 Polar Plot with Error Bar
Polar-ErrBar
Summary
This tutorial will demonstrate how to create a Polar graph with error bars:
What you will learn
This tutorial will teach you how to:
- Create a Polar graph with error bars
- Customize the graph using the Plot Details and Axis dialogs
Steps
- Import the data file PolarPlotwithErrorBar.dat under <Origin EXE Folder>\Samples\Graphing\ path (Minimum Origin Version: 2015 SR0), or you can download this data file directly and import into Origin.
- Hover your cursor over col(C) till it appears as a downward pointing arrow and click to highlight column C. Right-clicking produces a menu where this column can be set as Y error.
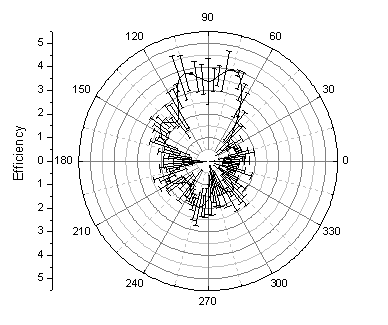
- In order to plot the Polar graph of the data with error bars highlight all the columns. In the main menu select Plot > Specialized : Polar theta(X) r(Y) or click the Polar theta(X) r(Y)
 button on the 2D Graphs toolbar.
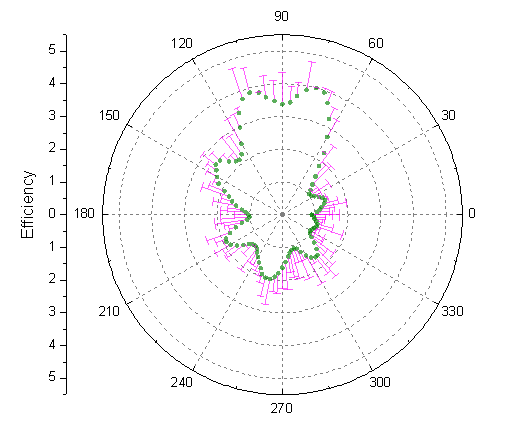
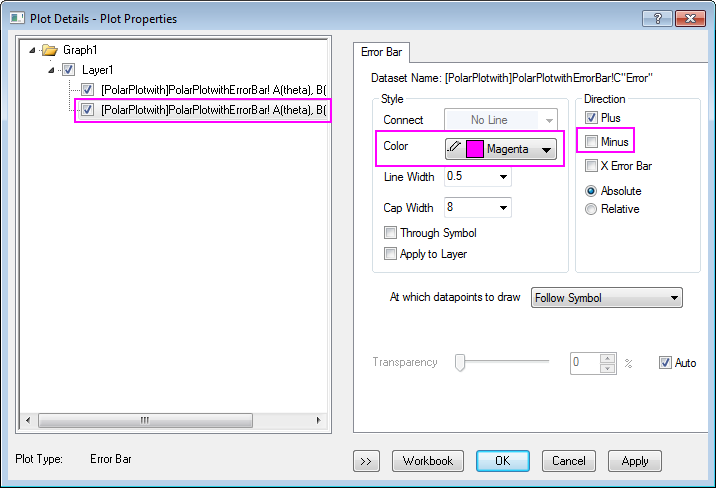
- Double-click inside the plot to open the Plot Details dialog. In the Error Bar tab change the Color to Magenta and remove the negative error bars by deselecting the Minus box as shown below:
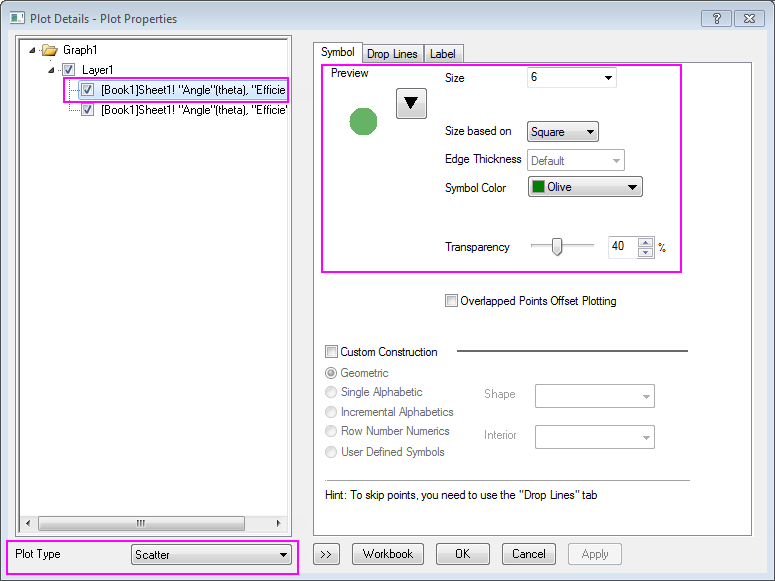
- If the left panel of Plot Details is hidden, click the button with the two arrows on the bottom left of the dialog box. The left panel presents a tree-view display of the layer and data the user is modifying. It also displays a Plot Type list at the bottom. Use the Plot Type list to change the plot from Line to Scatter. This will change the tabs on the right panel and add a Symbol tab. In the Symbol tab, change the symbol style, color, and transparency as shown below. To select the symbol color, use the Individual Color option in the Symbol Color button. Click OK to close the dialog.
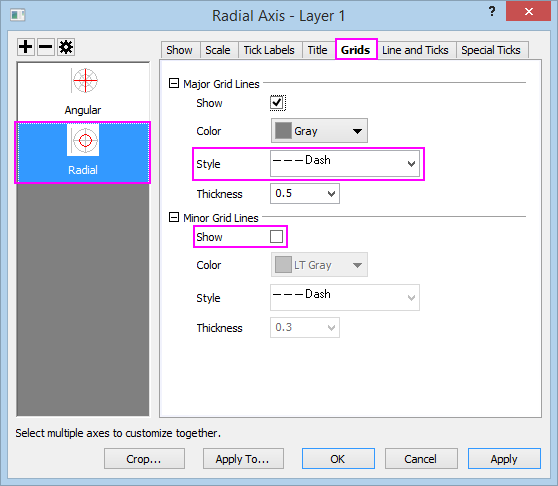
- The next step is to modify the radial axes grid lines. These are the circular grid lines between the inner and outer angular axes. Double-click the vertical axis on the left side of the graph, (i.e. the Radial Axis) to open the Axis dialog. In the Grids page, choose Radial on the left panel. Change the Major Grids Line Style to Dash, and then clear the Minor Grids Show check box as shown below:
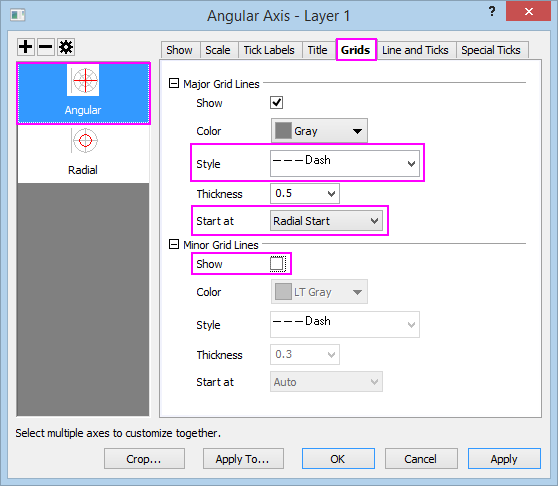
- Use the same procedure to modify the angular axes grid lines, the grid lines that radiate out from near the center of the plot to the edges. In the Grids page, choose Angular on the left panel. Change the Major Grids Line Style to Dash, set Start at to Radial Start, and then clear the Minor Grids Show check box. OK to save changes.
- The completed polar plot should appear as shown below: