提示:此部分只提供英文原文,敬请谅解!
6.13 Plot Functions with Parameters Defined in a Worksheet
Contents

|

|
Summary
Origin can plot functions. It also can plot functions with parameters defined in a worksheet. The function graph can be updated automatically as the parameters in the worksheet change.
What you will learn
This tutorial will show you how to:
- Define variables from a worksheet in the Set Values dialog box.
- Plot a function graph with parameters.
- Update a graph automatically when parameters are changed.
Steps
Let us use this function as an example:
y=p0+p1*x+p2*x^2
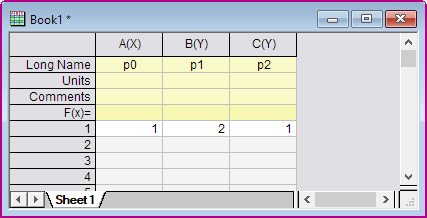
- Set up a worksheet with three parameters p0, p1, p2 stored in Column A, Column B, Column C as shown below.
- Click on the Add New Columns button
 on the Standard toolbar to add a new column to the worksheet.
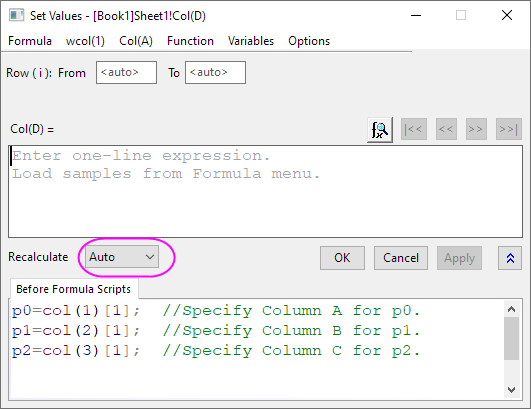
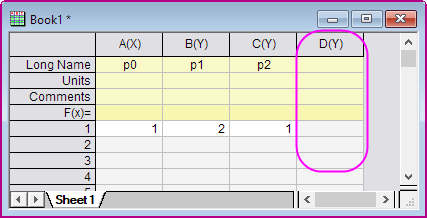
- Highlight Column D and then select Column: Set Column Values. Select Auto from the Recalculate drop-down. Type the script shown below to define the parameters in the Before Formula Scripts edit box. Click the OK button to close the dialog box.
- Note that there is a green lock icon
 on the top right corner of Column D which indicates that the Recalculate Mode is Auto.
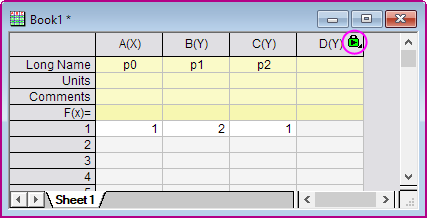
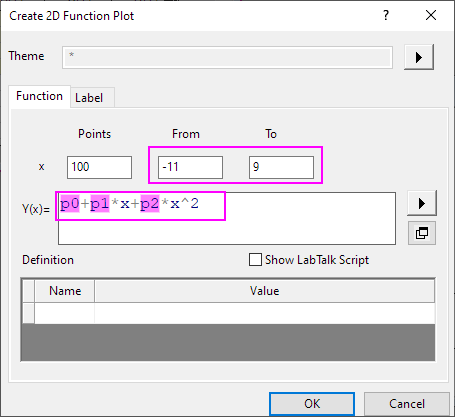
- Select Plot>Function Plot: New 2D Plot menu to open the Create 2D Function Plot dialog.
- In this dialog, set the options as follows and click the OK button to close the dialog box.
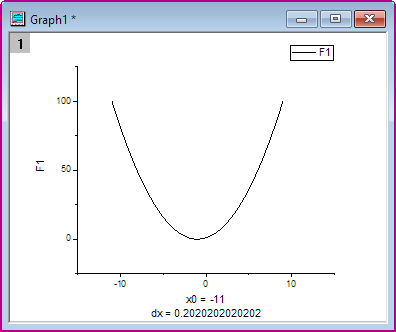
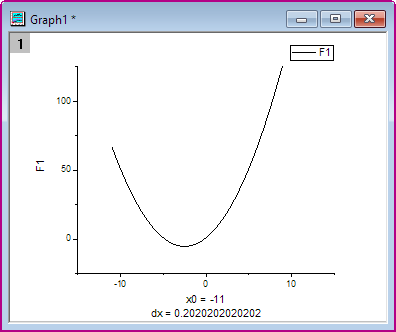
- Then you get this function plot.
- The function graph can be updated automatically when the parameters in the first row of the worksheet change. Change the value in the first row of Column 2 from 2 to 5. Click outside this cell to finish editing.
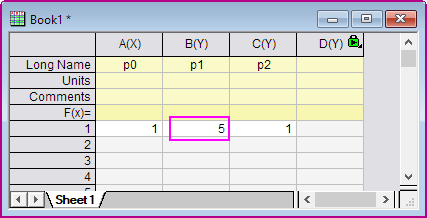
- The function graph updates to reflect this change.
Scripts
The script used in the Before Formula Scripts edit box of the Set Values dialog box is:
         p0=col(1)[1];  //Specify Column A for p0.
         p1=col(2)[1];  //Specify Column B for p1.
         p2=col(3)[1];  //Specify Column C for p2.
The function in the F1(x) edit box of the Plot Details dialog box is as follows:
p0+p1*x+p2*x^2