4.4.5.1 Picking and Marking Peaks
Pick-Mark-Peaks
Summary
The Peak Analyzer provides several methods to pick peaks automatically. Also, user can opt to add/delete/modify the peaks manually.
Labels are added to the peak centers after they are found or added, to show user the positions of the current peaks.
Minimum Origin Version Required: Origin 8.0 SR6
What you will learn
- How to use and customize the auto peak finding in the Peak analyzer
- How to customize the labels for the peak centers
Steps
- Start a new workbook and import the file <Origin Program Folder>\Samples\Spectroscopy\HiddenPeaks.dat.
- Highlight the second column.
- Create a line plot by selecting Plot: Line: Line.
- With the graph active, select Analysis: Peaks and Baseline: Peak Analyzer to open the dialog of the Peak Analyzer.
- In the first page (the Start page), select the Find Peaks radio button in the Goal group. Then click the Next button to go to the next page.

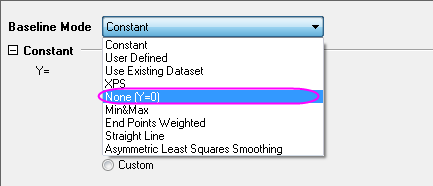
- In the Baseline Mode page, select None(Y=0) for Baseline Mode.
- Click the Next button to go to the Find Peaks page.
- In the find Peaks page:
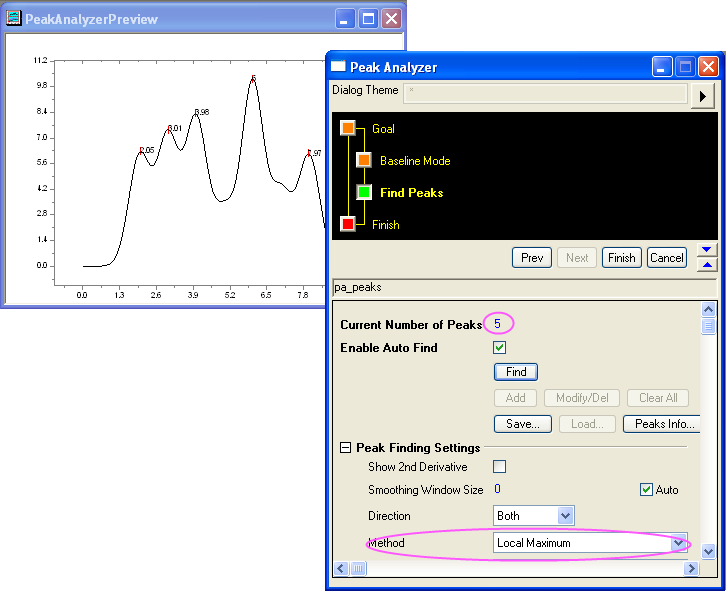
- Expand the Peak Finding Settings branch. Make sure that Local Maximum is selected for Method. Then click the Find button. Only five peaks are detected.
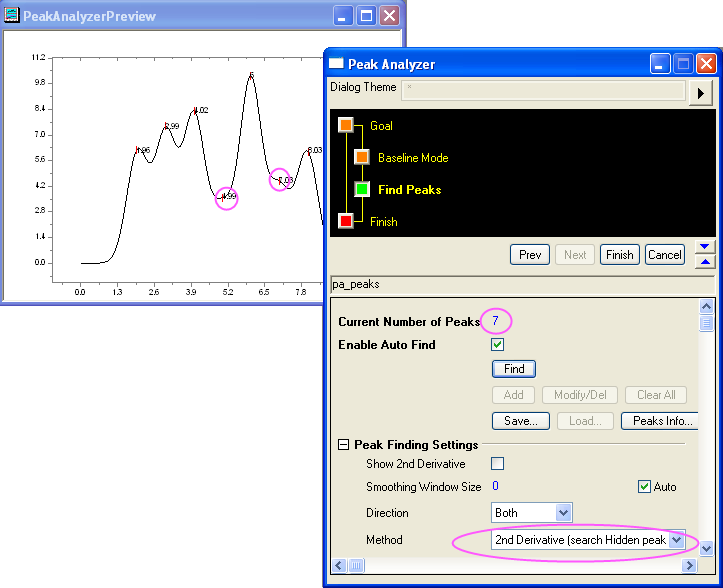
- Change Method to 2nd Derivative (Search Hidden Peaks). Click the Find button again. This time, seven peaks are detected.
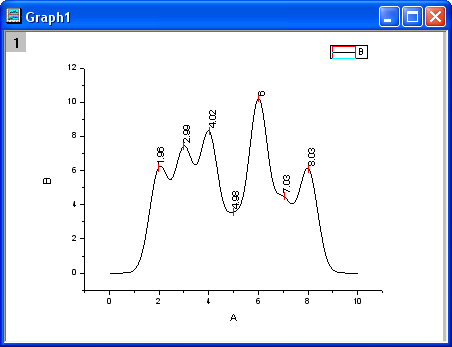
- Click Finish to complete the analysis. We will get this final graph: