10.2.1 Pasting or Embedding Graphs in Other Applications
Paste-Embed-Graph-OtherApp
Summary
It is possible to insert Origin graphs to other applications(e.g.Microsoft® PowerPoint/Excel/Word), either by object linking or embedding. Both linked and embedded graphs can be later edited with Origin.
The difference is that embedded graph is contained in the destination file while the linked graph is not. A linked graph can be dynamically updated if the source graph is changed.
What you will learn
This tutorial will show you:
- How to copy and paste the graph to Word as a linked graph.
- How to copy and paste the graph to Word as a embedded graph
- How to edit linked/embedded graphs after inserting to Word.
Steps
- Launch Origin, open the OffsetY.opj project from <Origin program folder>\Samples\Graphing\. This project contains a graph (Graph 1).

- With the graph window active, select Edit: Copy Page.
 | Another menu option Copy Graph as Picture are also available. You can select it to insert the graph into Word(or other applications) as a picture. Then, you are not allowed to edit it with Origin anymore.
|
- Create a blank page in Microsoft® Word(Here, I am using Word 2010). In the Home tab, select Paste Special... under the Paste option.

- In the Paste Special dialog, select the Paste link radio button and then choose Origin Graph Object in the As list. Click OK to close the dialog.
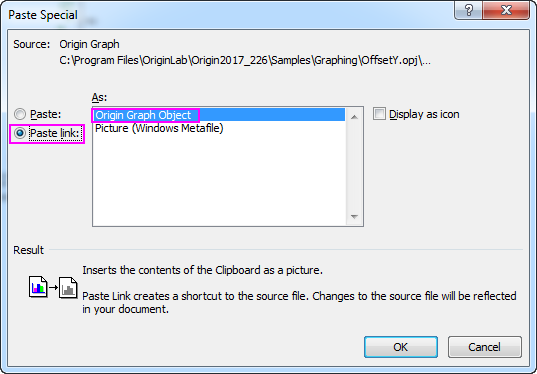
The graph will be inserted to current position a linked object.
- Open the Paste Special dialog again similarly as the previous step.
- This time, select the Paste radio button then choose Origin Graph Object in the As list. Click OK to close the dialog. The graph will be pasted again, but as an embedded object.

- Go back to the OffsetY.opj file in Origin, double click on the olive dot plot in Graph 1, bring up the Plot Details dialog, change the symbol color to Violet and click OK to close the dialog.
- Now switch to Word file we just created, right-click on the first graph(the linked one), and choose Update Link from the fly-out menu. The color of the dot plot in this graph will be changed to violet.

- Right-click on the second graph(the embedded one), and choose Graph Object: Edit to reopen the graph in Origin. Note that the graph name is Graph in Document1, indicating that the graph is contained in the destination file.

- In the Graph in Document1, change the color of olive dot plot to blue similar as previously, and close Origin. Note that the linked graph and the embedded graph looks different now.