

|
|
|
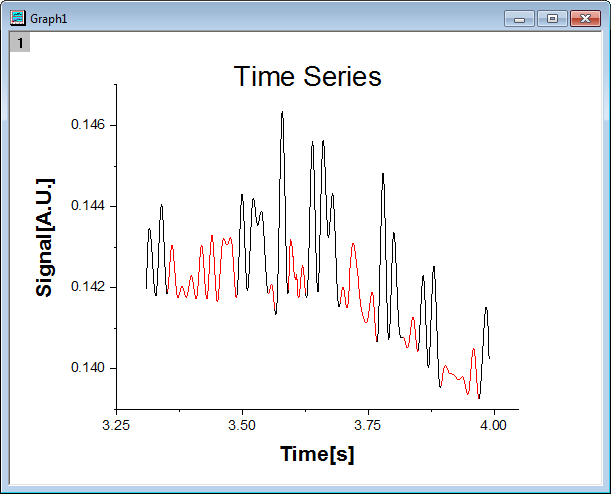
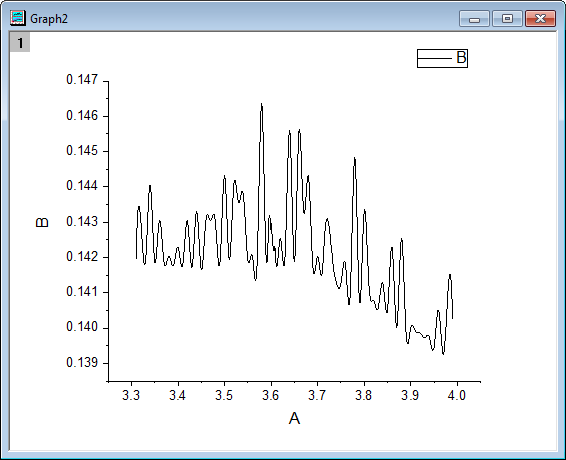
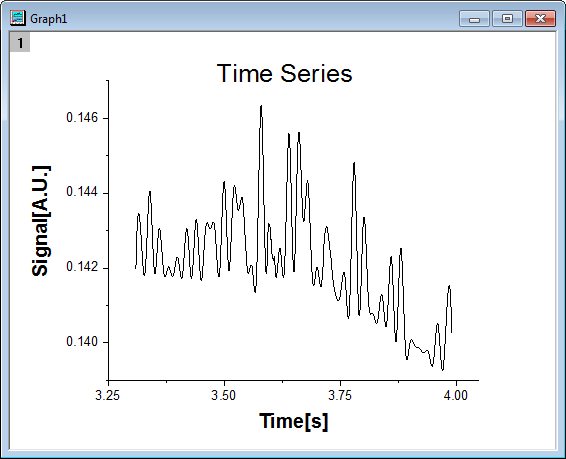
You can masking subranges of data graphically. In this tutorial, a line graph is created first, then the masking tool is used to mask the low peaks on the graph.
Minimum Origin Version Required: Origin 2015 SR0
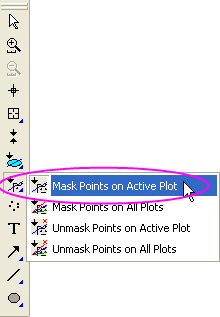
Beginning with Origin 2021, there is a change to data point selection mode of the masking tools:
|