4.1.5 Interpolate Gadget
Interpolate-Gadget
Summary
Origin supports the interpolate gadget to perform quick interpolation on a ROI (Region of Interest) range when a graph is active. And you can easily to change the interpolate region by moving the ROI.
What you will learn
- How to easily interpolate data points on a rectangular region.
- How to quickly find out an interpolated Y value from any given X value.
- How to output the interpolated values to Script Window, Result Log, or a specified worksheet.
Steps
This tutorial is associated with <Origin EXE Folder>\Samples\Tutorial Data.opj.
- Open Tutorial Data.opj and browse to the Interpolate Gadget folder in Project Explorer (PE).
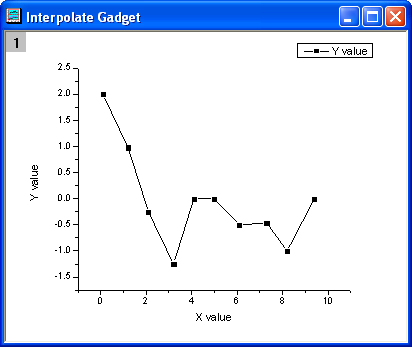
- Highlight the Col(A) and col(B) in workbook Book1R and plot a Line +Symbol graph.
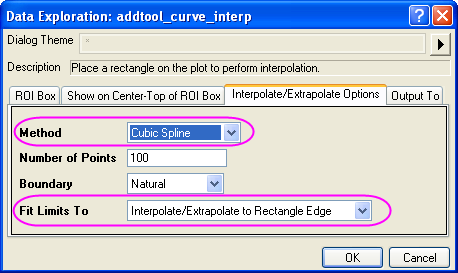
- Select Gadgets: Interpolate from the Origin menu when a graph is active, to bring up the Interpolate: addtool_curve_intep dialog box.
- Go to the Interpolate/Exterpolate Options tab. Choose Cubic Spline for the Method, and then select Interpolate/Extrapolate to Rectangle Edge for Fit Limits To.
- Click OK button. It will add an interpolation line onto the plot. And the Y values of interpolation line at right and left are shown at the top of the rectangle region.
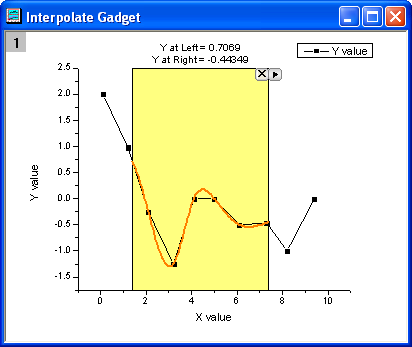
- You can change the data range by moving or resizing the yellow region of interest rectangle, the interpolated curve displayed will update as the ROI is being moved.
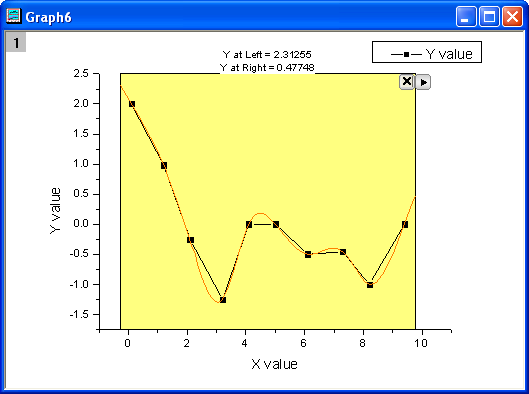
Click the triangle button  and select Expand to Full Plot(s) Range in the fly-out menu to interpolate the total area for the curve.
- This gadget also allows you to find Y values from a given X value. Click the triangle button and select Interpolate X/Y to open the Interpolate Y from X dialog. You can enter multiple X values and click the interpolate button. This tool will output the interpolated Y values for each of the X values.
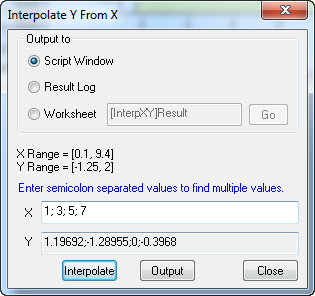
- The interpolated Y values can be output to Script Window, Result Log, or a specified worksheet.