提示:此部分只提供英文原文,敬请谅解!
4.1.2 Integrate Gadget
Contents

|

|
Summary
The Integrate Gadget performs numerical integration on a data plot to calculate the area under the curve. You can select an arbitrary range of the data plot using the region of interest (ROI) object overlaid on the plot.
What you will learn
- How to easily integrate a segment of data plot under the rectangular region.
- How to specify the integration limits and baseline.
- How to display the integral curve inside the ROI and calculate quantities including: peak area, peak height, peak center, and FWHM.
Integrate and output the quantities
- Start with a new workbook and import the Origin sample data Multiple Peaks.DAT which is located in <Origin Program Folder> \Samples\Curve fitting.
- Highlight the Col(C) and select Plot > Basic 2D: Line from the Origin menu to draw a graph.

- Select Gadgets: Integrate from the Origin menu when a graph is active, to bring up the Integrate: addtool_curve_integ dialog box.
In Integration tab, choose Restrict to Rectangle in the Integral Curve drop-down list to plot the integral curve within the rectangle.

- Click OK button. You will see that a yellow rectangle and a blue integral curve are added to the plot.
The integral area is filled with gray, and the value is shown at the top of the rectangle.

- Move the yellow region of interest rectangle to set the region for the single peak you want to integrate.

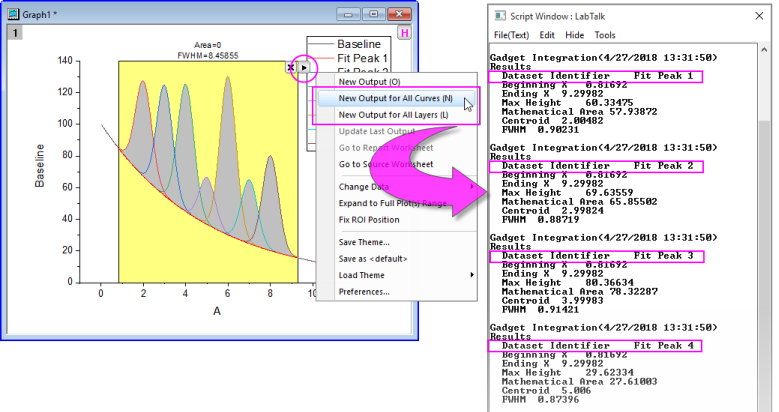
- Click the triangle button
 at the top right corner of the ROI tool to open the fly-out menu and choose New Output. Then the Gadget Integration Results will display in the Script Window.

Integrate with a data plot baseline
- Start with a new workbook and import the file <Origin Program Folder>\Samples\Spectroscopy\ Peaks with Base.DAT
- Highlight Col(B) and Col(C) and select Plot>2D: Line: Line from the Origin menu to draw a graph.

- Select Gadgets: Integrate from the Origin menu when a graph is active, to bring up the Integrate: addtool_curve_integ dialog box.
- In Baseline tab, choose Use Existing Dataset for the Mode. Then select Plot(2): Base as Dataset and click OK button.

- Click the triangle button and select Expand to Full Plot(s) Range in the fly-out menu to integrate the whole range of the curve starting from the baseline.

- Select New Output from the fly-out menu to output the results to the script window.
Some gadgets operate on a single curve at a time, but you can repeat your analysis for other curves by clicking on the fly-out menu and choosing New Output for All Curves or New Output for All Layers.
|