Origin provides many tools for statistical analysis. Advanced statistical tools are available in OriginPro. In this lesson, we will work with tools available in standard Origin.
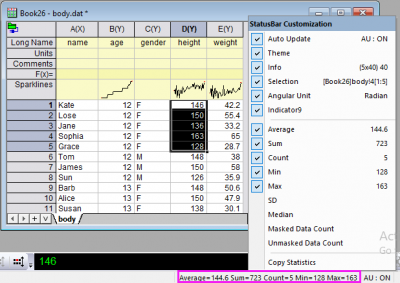
![]() | You can right-click on the statistics listed in the status bar to customize what quantities to display there. |

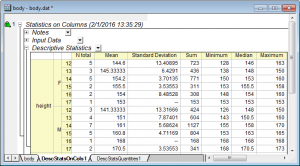
![]() | The numeric display in all report sheets can be globally set using the Digits in Report control on the Numeric Format tab of the Options dialog accessible from the Preference: Options main menu. |
nint(100+20*normal(100))The column will be filled with random integer numbers centered around 100.


![]() | The Plot: Statistical menu provides multiple histogram plot options when a worksheet is active. This Frequency Counts tool provides an alternate way to first perform counting, and then plot a histogram from the results. This allows for more flexibility and customization such as adding labels to the columns. |
![]() | The ANOVA dialog box provides two options for input mode: Indexed or Raw. You can refer to the FAQ-333: What is indexed versus raw data and how to transform from one to another? to learn more about how data can be arranged for either mode. |


Save your project file.