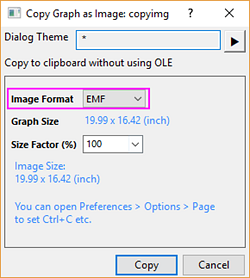
In this lesson we will learn about some of the options available for publishing graphs.
![]() | When the Origin graph is placed as an embedded object in applications such as Word or PowerPoint, all the data associated with the graph are also saved with the Word document. This provides the flexibility of double-clicking and editing the graph in a new instance of Origin. However, if many graphs are placed as objects in a document, the document file size will become large if there is a lot of data associated with the graphs. |

![]() | Double-click on the icons in Favorites folder to open the graph for viewing or editing. Right-click on the icon or the graph window title bar for a context menu command to go to the original folder for that graph. |
![]() | The dialog for sending graphs to PowerPoint has options for selecting all graphs in the project, specifying graphs by name, and placing the graphs on duplicate copies of a specific PowerPoint file slide that you can prepare prior to the operation. |
![]() | In the bottom panel of Project Explorer, switch to Details view (right-click in an empty location and choose View: Details). Right-click on the lower panel title bar and enable Slide. Note that you can drag to reorder the columns. Use the added Slide column to arrange the order of the graphs. Click on the slide column header once, and then you can drag and rearrange the graph entries to set the order. This order will be followed for operations such as slide show, pushing graphs to PowerPoint, and exporting. |

Save your project file.