

|
|
|
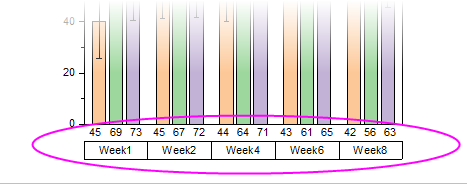
Origin supports grouped column graphs with indexed data. Multiple group levels are supported. Grouping information can be shown in tick label tables on the X or Y axes.
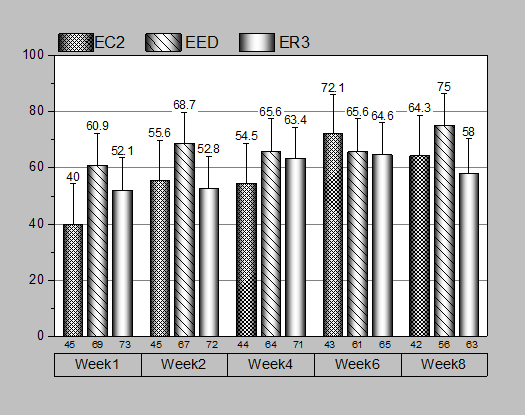
This tutorial will show you how to


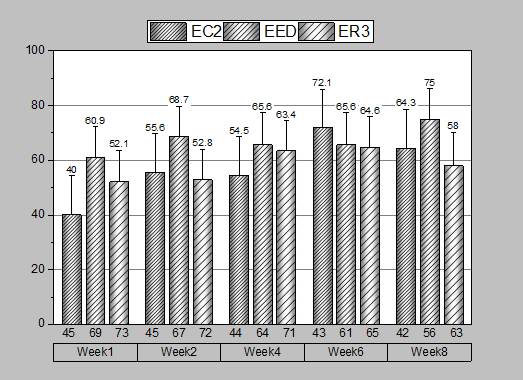
The tutorial steps that follow, further customize the graph so that it looks like the image in the Summary section.

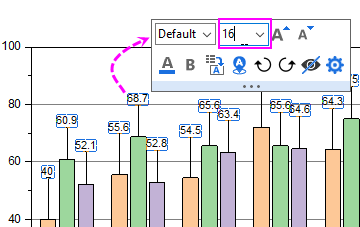
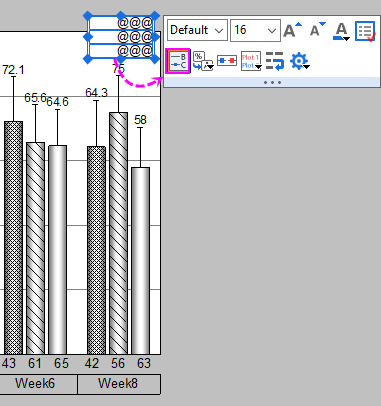
To format the label values, you can double-click on the labels to open the Labels tab of Plot Details dialog to set the Numeric Display Format drop-down list. For instance, to show a single decimal place for each label, enter ".1", then click OK. For more information, see Custom Numeric Formats |


To center and adjust margins on a finished graph, click on the graph to activate it, then choose Graph: Fit Layers to Page. Enter your Margin and determine whether to Maintain Layer Aspect Ratios, then click OK. |