Sometimes, one may want to perform "Dataset Fitting", that is, the output may be composed of one or several datasets, like:
For example, you may want to analyze a composite spectrum to find the contributions/ratio from individual component spectra. This can be accomplished either by defining multiple independent variables or by calculating the "combination" inside the fitting function.
Minimum Origin Version Required: Origin 8.0 SR6
This tutorial will show you how to:
Import the Composite Spectrum.dat file from the \Samples\Curve Fitting\ folder. In this sample data, we can see that column A is the index, columns B and C are the values for the spectrum of components A and B. Column D contains values obtained after reading a composite spectrum of components A and B. By fitting column D to an equation determined by the component spectra of the pure forms of columns B and C, the coefficients for the contributions of B and C (call them c1 and c2 respectively) can be found. (Note: In this case, we supposed the independent and dependent variables have the same size. If not, interpolation is need.)
Bring up the Fitting Function Organizer and define a new fitting function as follow:
| Function Name: | MultiIndep |
| Function Type: | User-Defined |
| Independent Variables: | a, b |
| Dependent Variables: | ab |
| Parameter Names: | C1, C2 |
| Function Form: | Origin C |
| Function: | ab = C1*a + C2*b; |
Initialize both C1 and C2 to 1 in the Parameter Initialization edit box by entering:
C1=1;
C2=1;
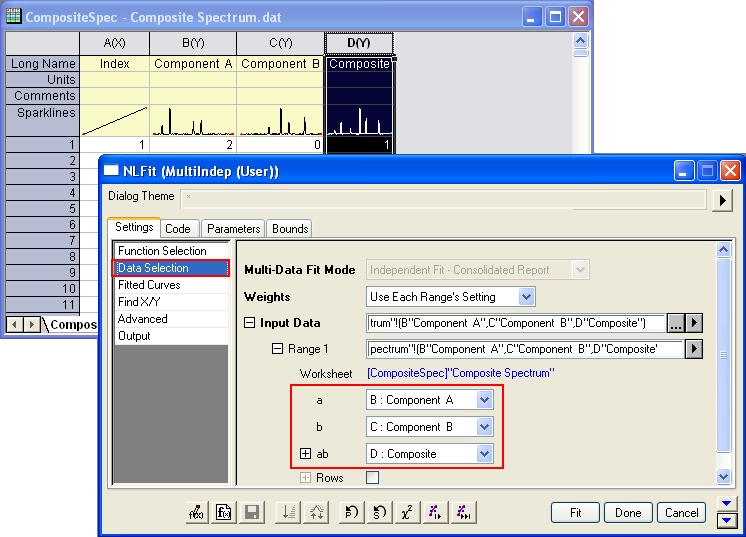
Save the fitting function and close Fitting Function Organizer. Highlight ONLY Column D and bring up the NLFit dialog, specify the input datasets in the Data Selection page as follow:
Then you can click the Fit button to generate results.
You are supposed to get these results:
| Value | Standard Error | |
| C1 | 0.37169 | 0.00483 |
| C2 | 0.66469 | 0.0047 |
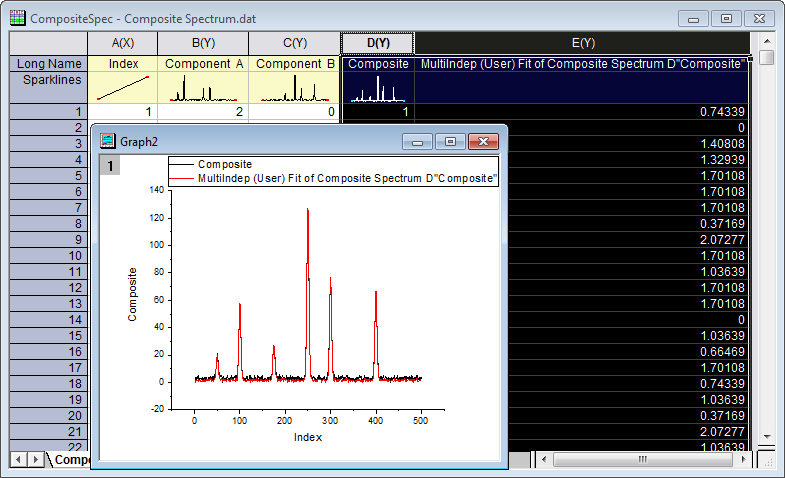
To verify the fitted results, you can add a new column and Copy + Paste the fitted value, which comes from the fitted Y (col(C)) in the worksheet FitNLCurve1, into it. Then Highlight the Composite and the fitted data and plot a line graph to see how good the fit is: