5.1.4 Distribution Fit
dist-fit
Summary
Knowing the distribution model of the data helps you to continue with the right analysis. or make estimation of your data. The Distribution Fit tool helps users to examine the distribution of their data, and estimate parameters for the distribution.
What you will learn
This tutorial will show you:
- How to carry out distribution fit for practical data with Origin
- How to interpret the generated results
User Story
A house builder is trying to decide how many new houses he should build in the next year based on past sales of houses in the surrounding area. He would like to know the following:
- If he is going to build 80 new houses, what is the probability that all of them will be sold?
- The builder believes that he can make a profit if there is at least a 60% probability that he will sell all of his houses. How many houses should he build?
To solve this problem, The house builder needs to:
- Perform a distribution fit to sample data (houses sold in the surrounding area)
- Select the best fitting distribution
- Calculate the probability using the cumulative distribution function of the selected distribution
- If the probability is more than 60%, reconsider the schedule.
Choosing Distributions
- Start with a new project or a new workbook. Import the data file: \Samples\Statistics\HouseSold.dat
- Highlight Column B, select Plot > Statistical > Histogram from Origin menu
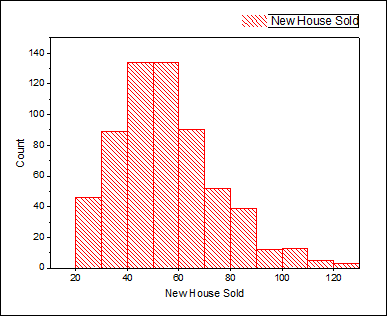
- Consider the facts as below to choose the distributions:
- The data are taken on integer values only so we can consider to fit both continuous and discrete distributions. (If there are floating point numbers, only continuous distributions can be considered). However, as usually continuous distributions provide better fit than discrete distributions we want to choose from continuous distributions.
- Value of new house sold are positive values, we don't need to consider the normal distribution, which can take on negative values
- Look at the histogram, the data is clustered around a value, we don't need to consider the exponential distribution, which is for data extremely asymmetric
Performing Distribution Fit
- Return to the HouseSold worksheet and highlight the column B. From the Menu Bar, select the Statistics: Descriptive Statistics: Distribution Fit menu
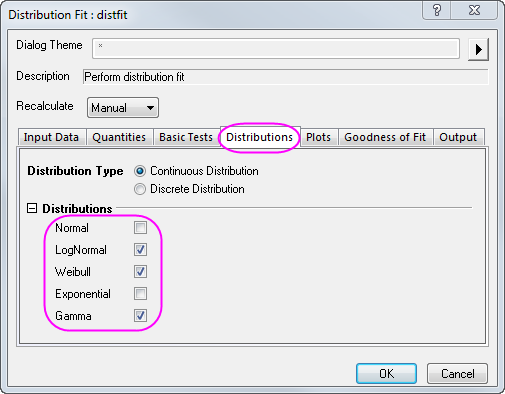
- In the dialog that opens, in the Distributions tab, clear Normal and select the following three distributions based on the conclusions in the Choosing Distributions section
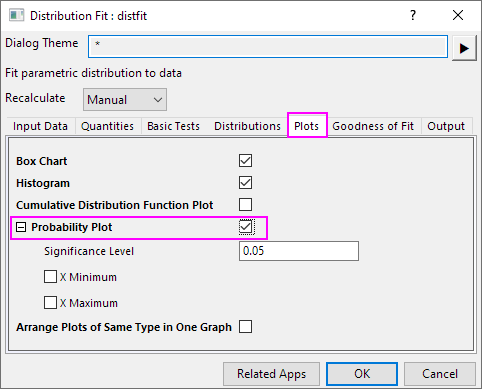
- In the Plots tab, select Probability Plot
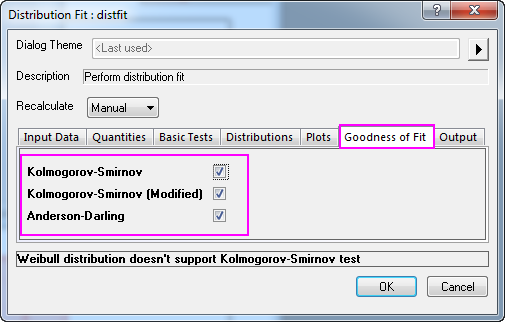
- In the Goodness of Fit tab, check all three methods. Click OK to apply the settings and close dialog.
Comparing and Selecting Fitting Models
We can compare and select a fitting model based on the following results of distribution fit:
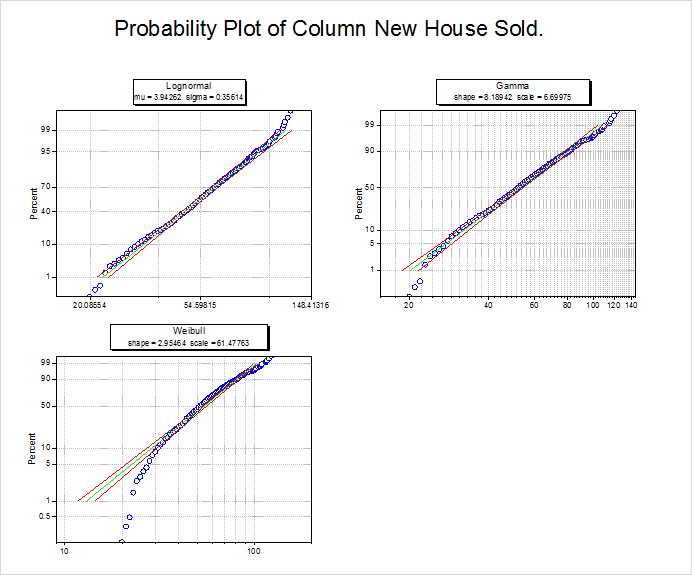
- Probability (P-P) Plot
- The closer all the scatter points are to the reference line, the better the distribution is for the dataset. From the Probability Plot, both lognormal and gamma distribution can be considered as good models for the data.
-
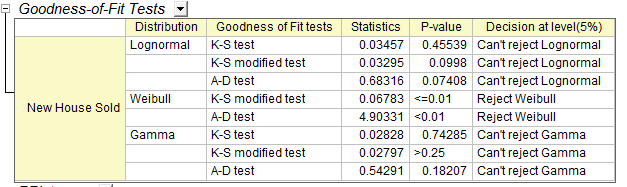
- Goodness of Fit Tests table
- Look at the P-values in table, if the p-value is less than 0.05, it means we reject the distribution at the 0.05 level. P-value of lognormal and gamma are larger than 0.05, then from the Goodness of Fit Tests, we can see that both lognormal and gamma are good models for the data.
-
From the Probability (P-P) Plot and Goodness of Fit Tests table, we can draw a conclusion that lognormal and gamma are both good choices. Here we choose the lognormal as an example for further analysis.
Making Estimations
Once the best distribution model is found, we can use the CDF and INV functions to calculate these probabilities:
- If he is going to build 80 new houses, what is the probability that all of them will be sold?
- How many houses should be built if he hopes to have a 60% chance of selling all of the houses?
- To answer the first question, open the Command Window or the Script Window from the Windows menu, and type commands as below
-
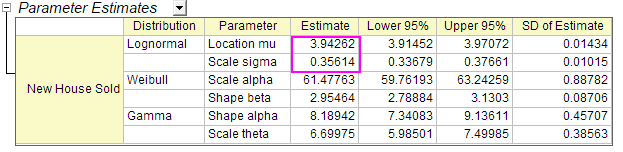
logncdf(80, 3.94262, 0.35614) =
- where 3.94262 is mu and 0.35614 is sigma, obtained from the Parameter Estimates table in the Report Sheet.
-
- You will get
logncdf(80, 3.94262, 0.35614) = 0.89136185728793
- We can conclude that if the house builder builds 80 new houses, there is an 89% probability that he will NOT sell all of those houses.
- To answer the second question, run the script below in the Command Window or the Script Window
-
logninv(1-0.6, 3.94262, 0.35614) =
- You will get
logninv(1-0.6, 3.94262, 0.35614) = 47.105650533425
- We can conclude that the house builder is more likely to make a profit if he builds 47 new houses.
 | We choose the lognormal model in Choosing Distribution section so we use logncdf and logninv for the estimation. If we choose gamma, we can use gamcdf and gaminv for the estimation, which will result in a similar conclusion.
|
Notes:There are also other descriptive statistics and graphs in results of Distribution Fit which help you to take a quick look of your data
- Descriptive Statistics table
- Quantiles table
- Histogram
- Box Chart
- CDF (Cumulative Distribution Function Plot)
|