9.4.1 Digitizer Tool
Summary
The Digitizer helps you to capture data from images of graphs. You can import image files of graphs into Origin and digitize data points one by one.
What you will learn
- How to capture data from images of graphs using the Digitizer Tool.
- How to modify the position of the picked points
- How to delete the extra points
Steps
Capture data points
-
Select Tools: Digitizer... from the main menu to open the Digitizer dialog.
-
Click the Import
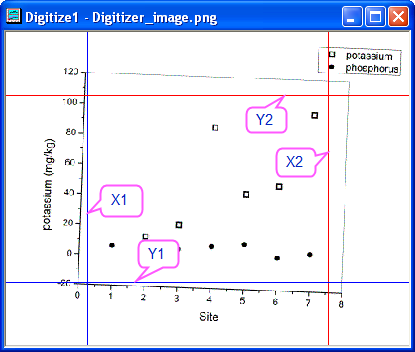
 button on the dialog box toolbar, and select the Digitizer_image.png under <Origin EXE folder>\Samples\Import and Export\ path. The image is imported. Note that there are two pairs of XY axes showing in the image; one red and one blue.
-
Click on the Rotate Image
 button (dialog box toolbar), and click the button
  to slightly rotate the image in the counter-clockwise direction. Note that the rotation increment can be specified in << >> Increment (degree) the text box.
When the graph axes in the image are aligned along the bottom/top and left/right edges, click once more on the Rotate Image button, to leave Rotation mode.
-
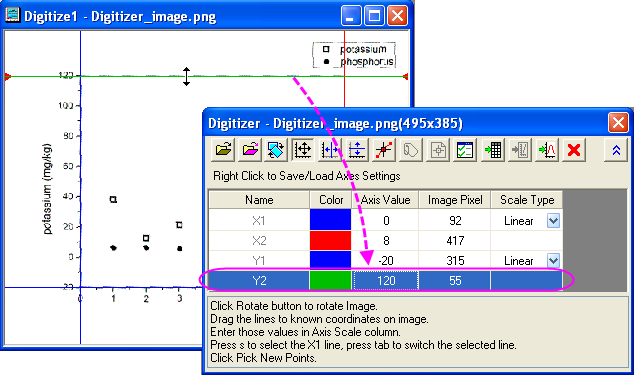
Click on the Edit Axes
 button in the dialog. Using your mouse, drag the two pairs of axis lines so that they coincide with minimum and maximum axis values. Note that when a line is selected, its corresponding row in the Digitizer dialog is also selected. Enter the appropriate coordinate value (0, 8, -20, 120) in the Axis Value column.
-
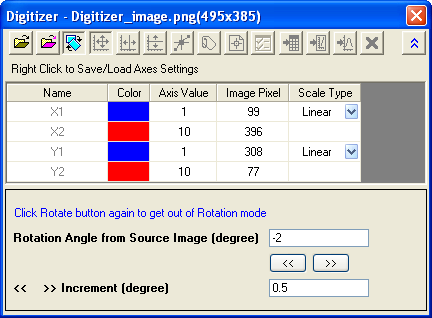
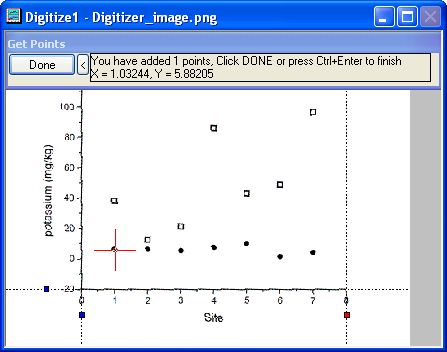
After locating the axes, click the Manually Pick Points
 button. Move the cursor
  sequentially over the points in the phosphorus plot (filled symbol), double-clicking on each point (or single-click and press Enter). The GetPoints dialog displays coordinate values, while the Data Display window shows image pixel values.
-
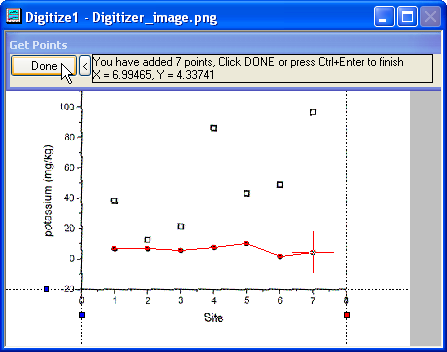
When you have added all points for the phosphorus plot, click the Done button.
-
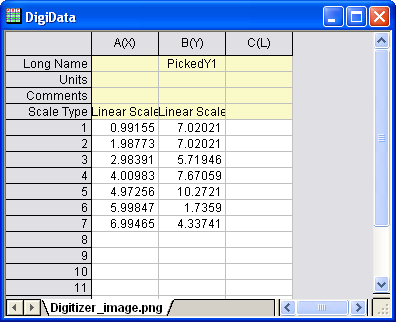
Click on the Go to Data
 button to show the resulting worksheet which contains the values of picked data points.
-
Click on the Go to Image
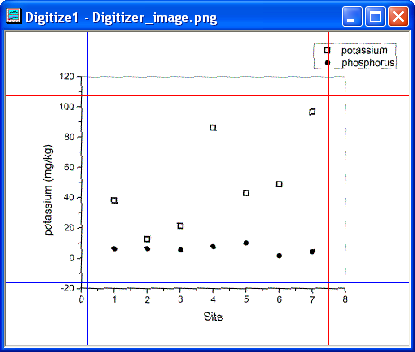
 button to return to the original image. Click on the New Line
  button to start digitizing the second plot (potassium = open symbol). Note that two new columns of data points are created in the result worksheet.
-
Click on the Manually Pick Points button to get the points for the second plot, repeating the procedures followed in steps 5 and 6.
-
Click on the Go to Data button and two datasets result shows in the worksheet.

-
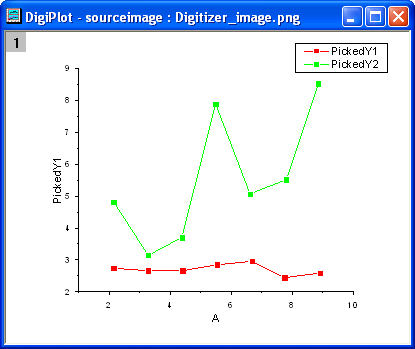
Click on the Go to Image button. This takes you to your imported image file. Click on the Go to Graph
 button and note that this opens a graph window containing plots of your digitized data points.
- When you close the Digitizer dialog, a Digitizer...
 button appears on the image. Clicking on the button, you can reopen the Digitizer dialog.
Move and delete the picked points
Following the steps in the above section, you will easy to get the points from the image. But if the picked points are on the incorrect position or extra, as point A and B in the below image, you can modify or delete them.

- To modify the position of point A, click on it and move the cursor to the correct position. Or you can use Arrow keys to move the selected point.

- To delete the point B, click to select it and right-click to choose Delete in the context menu. Or you can press Delete key to delete the selected point.