4.5.2.2 Data Reduction
Contents
 
|
 
|
Summary
Origin offers a number of tools which can be used for data reduction in worksheets: Data Filters, Worksheet Query and several X-Functions which reduce the number of data rows by different methods.
Minimum Origin Version Required: 2015 SR0
What You Will Learn
In this tutorial, you will learn how to:
- Reduce XY data to evenly spaced X
- Reduce Duplicate X Data for XY dataset
- Reduce XY data by Group
- Reduce worksheet rows
Steps
Reduce to Evenly Spaced X
- Create a new workbook and click the
 button to import the file Signal with High Frequency Noise.dat under <Origin EXE folder>\Samples\Signal Processing path.
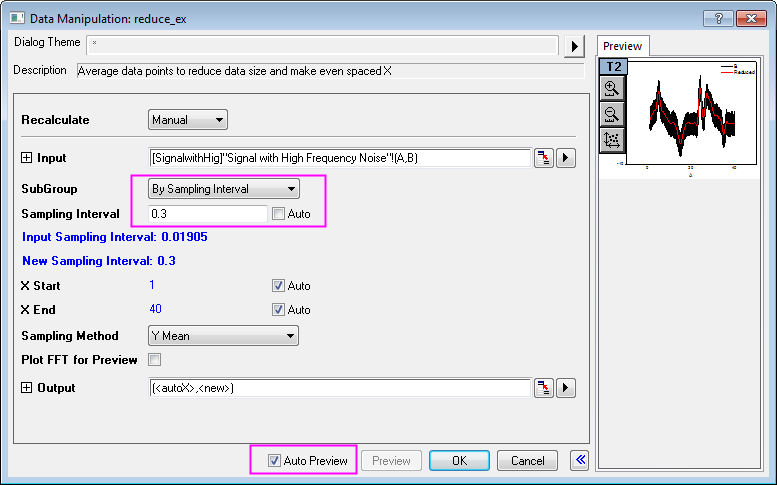
 - Highlight column B and select Worksheet:Reduce to Evenly Spaced X to open the reduce_ex dialog. Edit the settings so that they match the following.
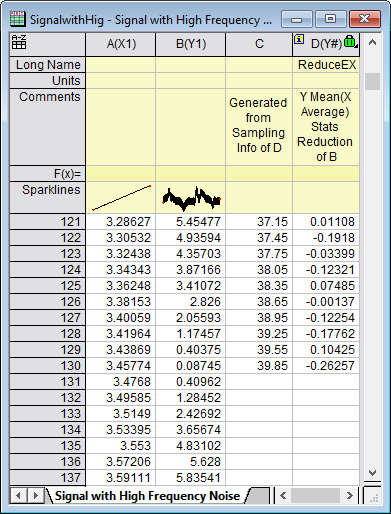
- Click OK. A new column (column C) is added to the worksheet. This column contains its own sampling interval information. Click on the column header to select the column then choose Column: Show X Column. In the Show X Column: colshowx dialog box, click OK to generate an X column using the sampling interval. You can see that the original XY dataset has been reduced by generating a new, larger sampling interval.
- Highlight column B and D (hold down the Ctrl key for multiple selection), and click the
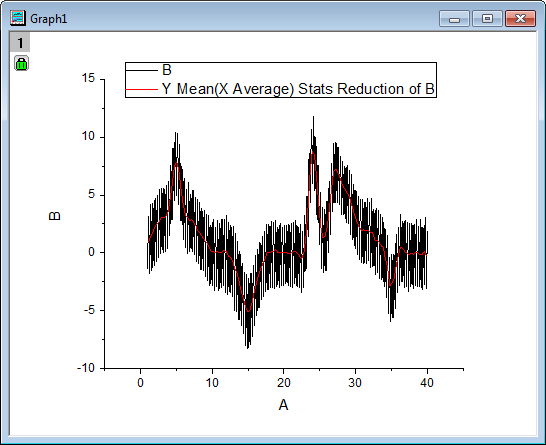
 button to generate a line plot for original (Black) and reduced (Red) data.
 - You can see from the plot that the data size is considerably reduced:
Reduce Duplicate X
- Create a new workbook and click the
 button to open the Import Wizard. Select the data files Step01.dat, Step02.dat and Step03.dat under the file path <Origin EXE Folder>\Samples\Curve Fitting\. Change the Import Mode to Start New Rows and make sure the default import filter step is applied. Click Finish to import these data files.
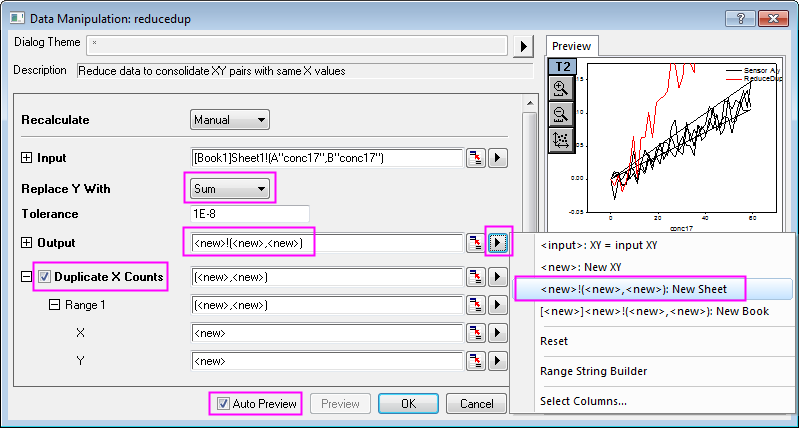
 - Highlight column A and B, select Worksheet:Reduce Duplicate X Data to open the reducedup dialog. Duplicate the settings as depicted below:
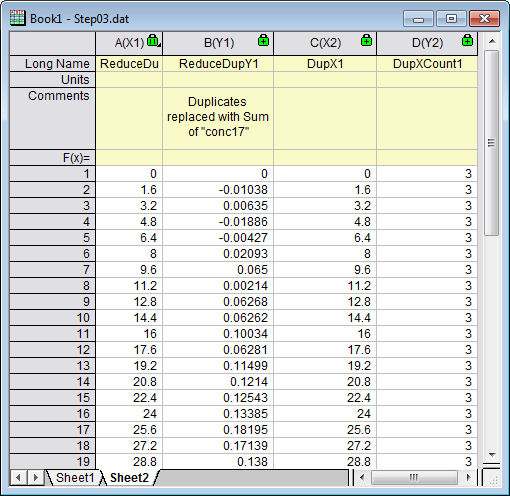
- Click OK to apply settings and in the results sheet Sheet2, we can see that for each X value, 3 duplicates are found. In the reduced dataset, the Y values for each duplicated X have been replaced by the sum of the Y values.
Reduce/Combine Duplicate Rows
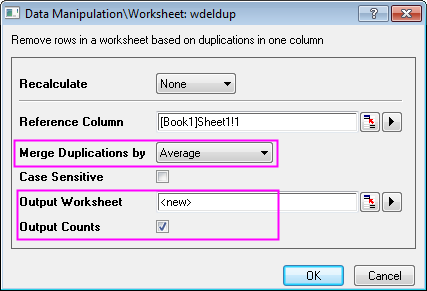
- Go to Sheet1 of the previous section, highlight column A and select Worksheet:Remove/Combine Duplicated Rows... to open the wdeldup dialog. Select Average from Merge Duplications by drop-down list, and click the right-sided triangle button on the Output Worksheet row to select <new>:New Sheet and check the Output Counts box and click OK.
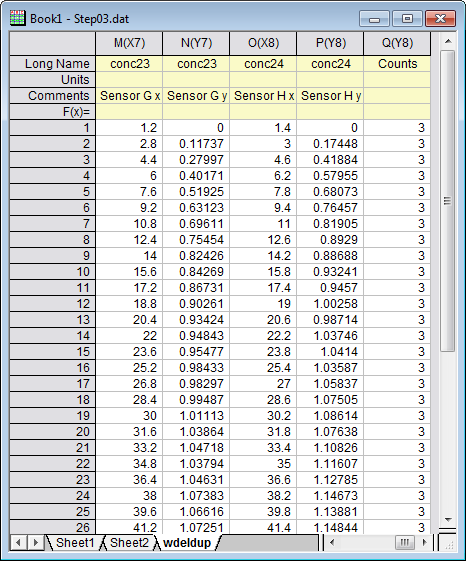
- Entire worksheet rows are reduced into the average values of merged rows which are determined by duplications in the selected column. A new column Counts is added to the end of the result worksheet wdeldup and it reports the number of duplicates found for each X value.
 | The tool Reduce Duplicate X works for XY dataset only, while the tool Remove/Combine Duplicate Rows works for an entire worksheet. You can also remove duplicate XY data from an XYZ dataset by using the Statistics on Columns tool, please refer to this Quick Help. |
Reduce by Group
- Open a new workbook, then click the button to import the Magnetization.dat file under <Origin EXE folder>\Samples\Data Manipulation path.
- Highlight columns A and B and click the button to generate a line plot.
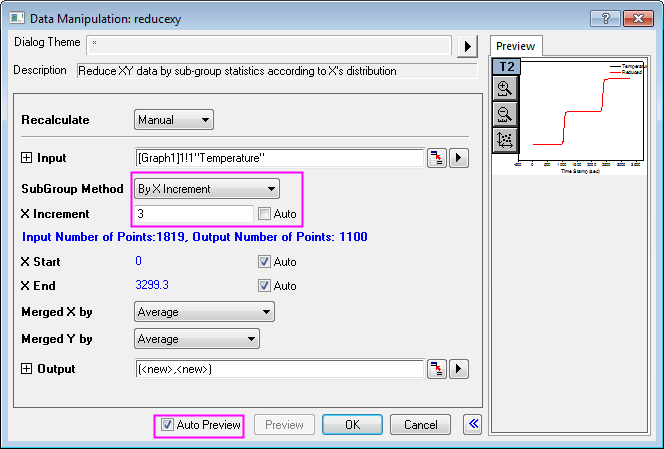
- Activate this graph and select Worksheet:Reduce by Group to open the reducexy dialog. Edit your settings as below:
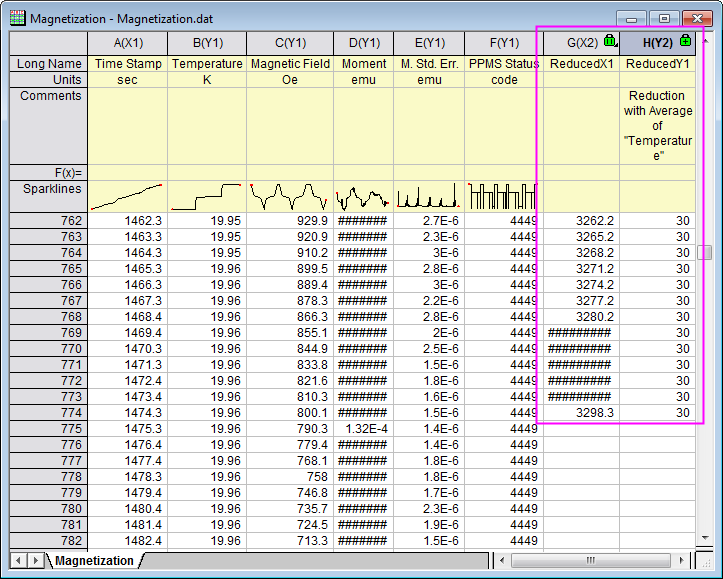
- Click OK to reduce the data. The reduced XY dataset will be added as two new columns at the end of original worksheet:
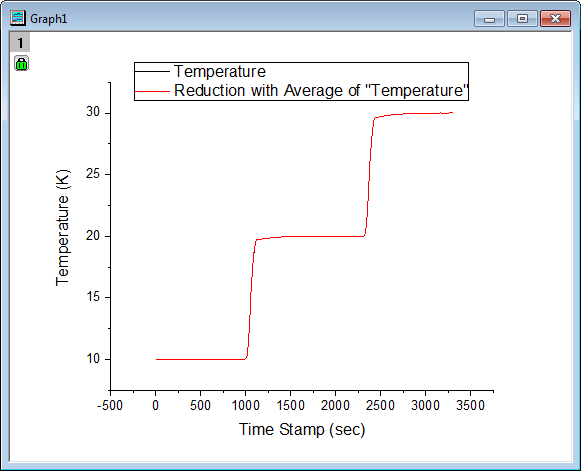
- The reduced XY dataset is added as a new data plot to the original graph:
Reduce Worksheet Rows
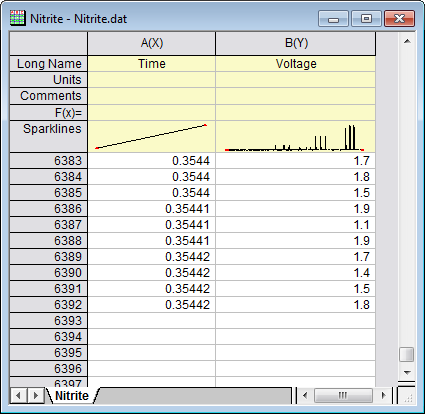
- Open a new workbook, then Click the button to import the file Nitrite.dat (path is <Origin EXE folder>\Samples\Spectroscopy). There are 6392 data points in this file.
- Highlight both columns in the Nitrite worksheet and select Worksheet:Reduce Rows to open the wreducerows dialog, and edit the settings to match the image below:
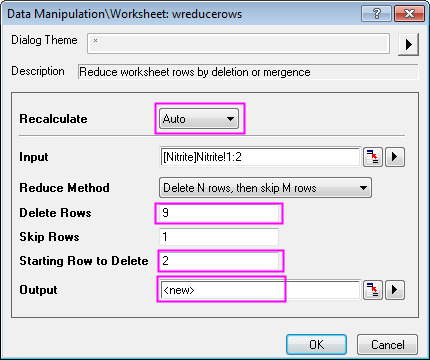
- Note: You can select the arrow button right to the Output select box and choose <new>:New Column(s) to make the selection.
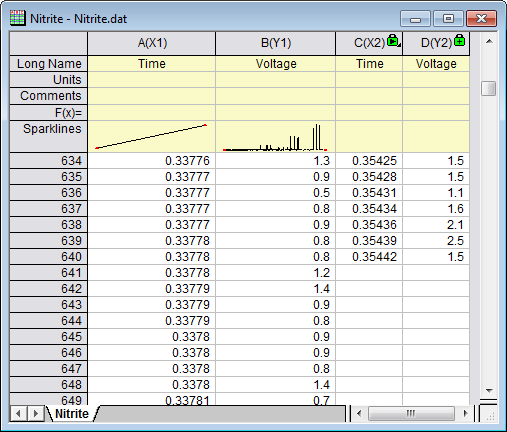
- When you click OK, only the first of every 10 rows is kept. Ninety percent of data points are discarded. Remaining data points are output to new columns:
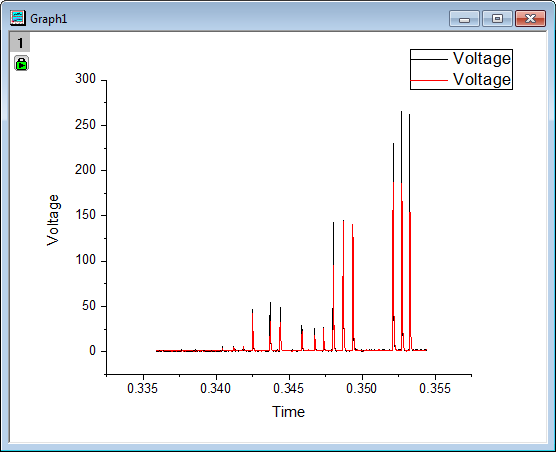
- Select the entire worksheet and click the button to generate line plots for original (Black) and reduced (Red) data:
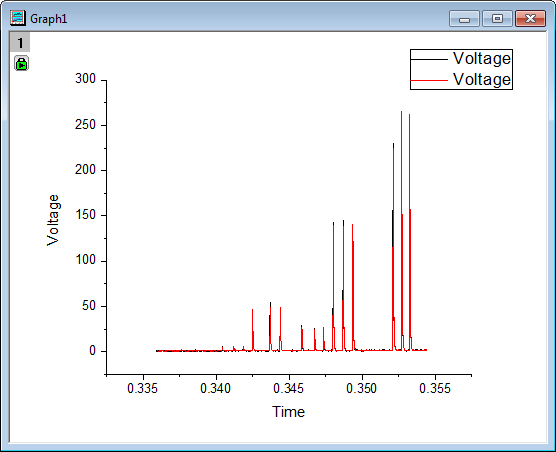
- Note that peak heights were changed with data reduction. To maintain data plot shape, we should keep more data points. Click the green lock on Graph 1 and choose Change Parameters to open the wreducerows dialog again. Change the value of Delete Rows to 3 and click OK.
- This time 25% of data points were kept, better preserving the shape of the original data plot.