6.5.4 Micro-Raman spectroscopy of complex nanostructured mineral systems
Customize-MutliLines-Graph
Summary
This tutorial will show you how to create a multiple line plot and how to customize it.
Minimum Origin Version Required: Origin 2015 SR0
Steps
- Create a new worksheet. Select Help: Open Folder: Sample Folder... to open the "Samples" folder. In this folder, open the Graphing subfolder and find the file Micro_Raman_Spectroscopy.txt. Drag-and-drop this file into the empty worksheet to import it.
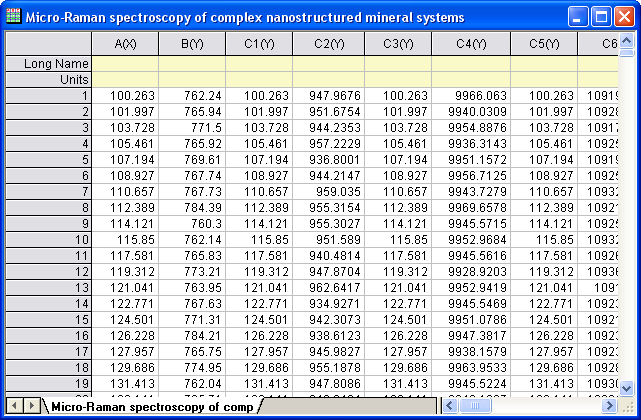
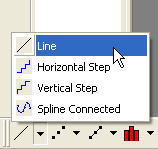
- Highlight all the columns in the worksheet. Right-click and select Set As: XY XY from the context menu. Then click the Line button on the 2D Graphs toolbar.
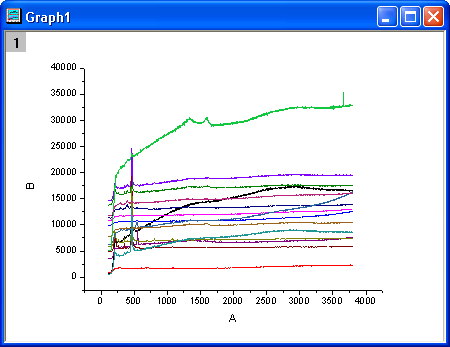
- Delete the legend. The graph should look like this:
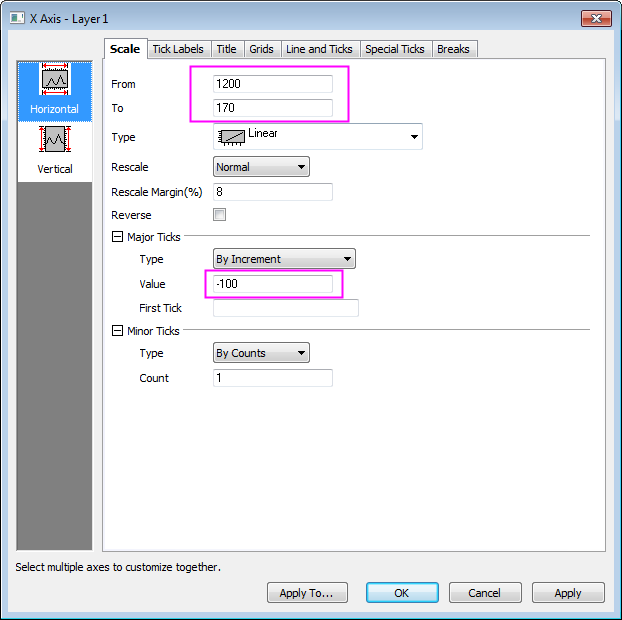
- Double-click on the X axis to bring up the Axis dialog box. In the Scale tab, set the options as the screenshots below.
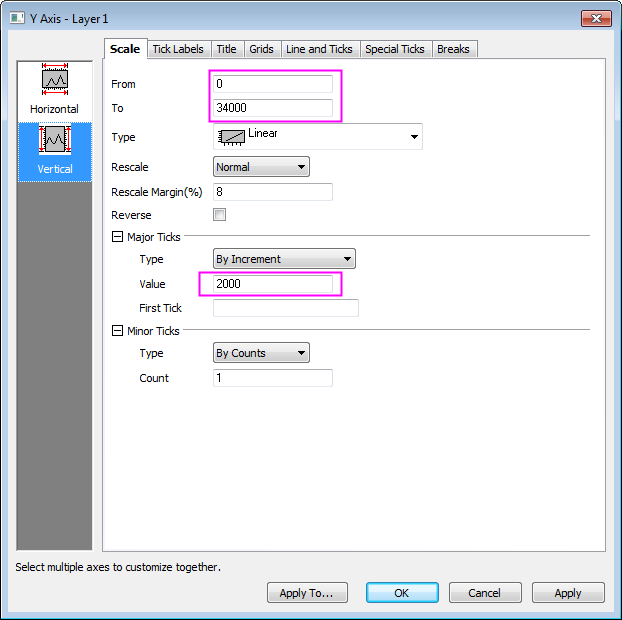
- Click the Vertical icon on the left panel to go to the Scale tab of Y Axis and then set the options as in the screenshots below and Click OK.
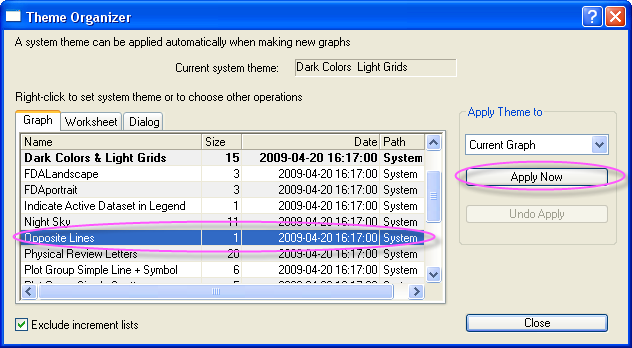
- Now, we will apply a Graph Theme to add a top X axis and a right Y axis. Select Preferences: Theme Organizer to open the Theme Organizer dialog. Activate the Graph tab and select Opposite Lines from the table. Then click Apply Now. Click Close to close the dialog.
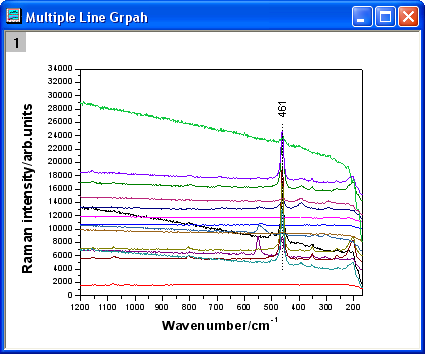
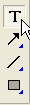
- Click the Line button on the Tools toolbar and draw a line across the peaks' centers as the sample image shows. Hold down the SHIFT key while drawing the line to force it to snap to the vertical. Double-click on the line. In the Line tab, select Dash with the Type drop-down list. Click OK.

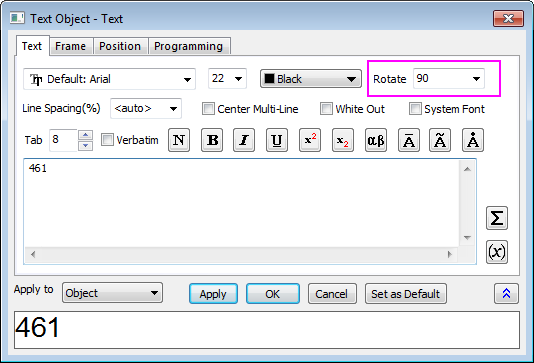
- Click the Text button in the Tools toolbar. Add a text object near the line object and enter 461 into the text object.
- Right-click on the text object and select Properties from the shortcut menu. In the Text of the dialog, set the options as in the screenshot below. Click OK.
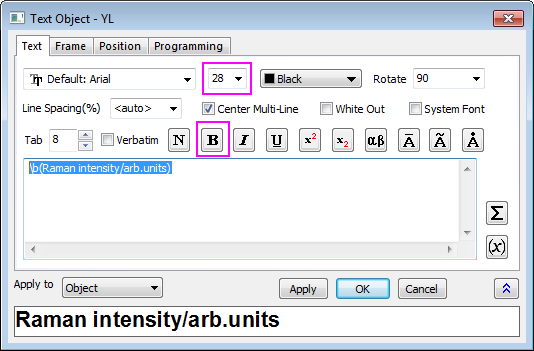
- Right-click on the title of the Y axis and select Properties from the short-cut menu. In the Text of the dialog, enter Raman intensity/arb.units in the edit box, highligh it, click the Bold button, and change size to 28. Click OK.
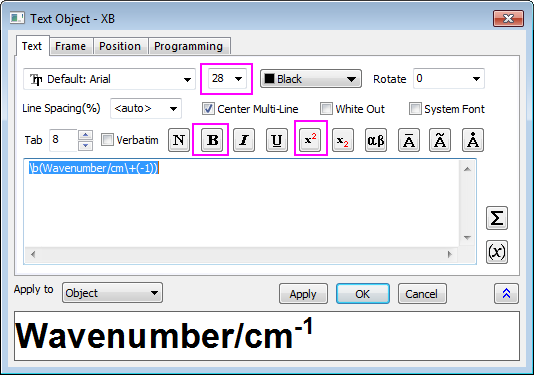
- Right-click on X axis title and select Properties from the shortcut menu. In the Text of the dialog, enter Wavenumber/cm-1 in the edit box, highlight it, click the Bold button, and change size to 28. Highlight -1 click SuprtScript button. Click OK.
- The graph should look like this: