4.1.3 Curve Intersection Gadget
CurveIntersection-Gadget
Summary
When there is more than one curve in a graph layer, you might want to calculate the intersection data points of these curves. Since Origin 8.6, a new gadget Intersect is available to calculate the intersection points of the input curves on the graph.
Minimum Origin Version Required: Origin 8.6 SR0
What you will learn
This tutorial will show you how to:
- Use the Intersect gadget on a graph.
- Tag the intersection points.
- Output the intersection points to worksheet.
Steps
This tutorial is associated with <Origin EXE Folder>\Samples\Tutorial Data.opj.
- Open Tutorial Data.opj and browse to the Curve Intersection Gadget folder in Project Explorer (PE).
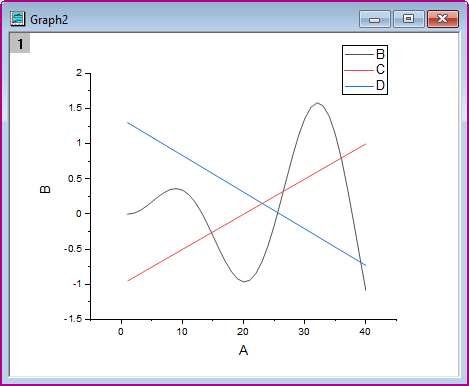
- Highlight the Col(A)~col(D) in workbook Book6B, and then click Plot > Basic 2D: Line to plot a line graph.
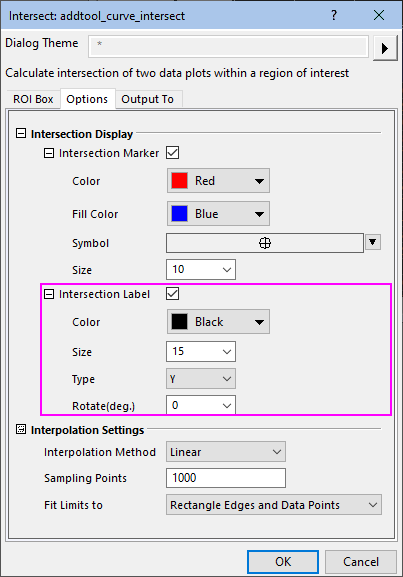
- Select Gadgets: Intersect... from the main menu to open the dialog. Go to the Options tab.
- Check the Intersection Label check box in the Options tab, set Size as 15, set Type as Y and set Rotate(deg.) as 0.
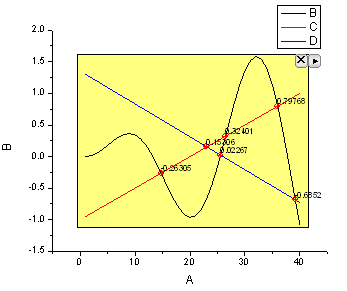
- Click OK button to go back to the graph window. The yellow ROI box will be added onto the graph.
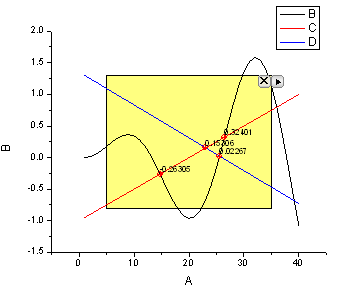
- Click the Arrow button
 at the top right of the ROI box, select Expand to Full Plot(s) Range from the context menu. The ROI box will be expanded to cover full plot range as shown below.
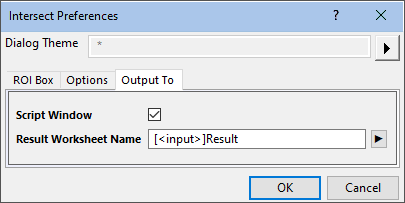
- Click the Arrow button at the top right of the ROI box. Select Preferences... from the context menu to open the Intersect Preferences dialog. Go to the Output To tab, click the flyout button
 to the right of Result Worksheet Name box and choose Sheet in Input Book.
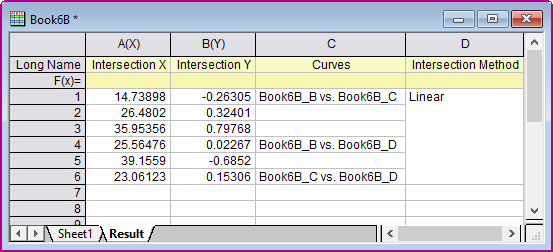
- Click OK button to go back to the graph window. Click the arrow button at the top right of the ROI box, select New Output from the context menu.
- The results will be output to the Script Window. Click the arrow button again, select Go To Report Worksheet from the menu. The X and Y coordinates of the intersection points will be listed in the results worksheet.