5.1.2 Cross Tabulation and Chi-square
Crosstab
Summary
Cross tabulation is particularly useful for analyzing categorical data. In these analyses, a contingency table is used to display the frequency distribution of two or more variables. Analyses based on the table can determine whether there is a significant relationship between variables, and assess the strength of the relationship between the variables.
Minimum Origin Version Required: Origin 2016 SR0
What you will learn
This tutorial will show you:
- How to perform the Cross Tabulation.
- How to interpret the results.
User Story
Our data are from the Montana Economic Outlook Poll conducted in May 1992, with accompanying demographics for 209 out of 418 poll respondents. We have data on seven variables: Age(under 35, 35-54, 55 and over),Sex(male, female),Financial Status(worse, same, or better than a year ago), etc. With the data, we want to learn:
- The frequency distribution of financial status in three different age groups, and whether male and female differ in the distribution.
- Whether there is significant relationship between "Financial status" and "Age" for male and female groups.
- The strength of the relationship.
Preparing Data for Analysis
- Open a new project or a new workbook. Import the data file \Samples\Statistics\MontanacOutlookPoll.dat
- We begin by sorting the categorical values.
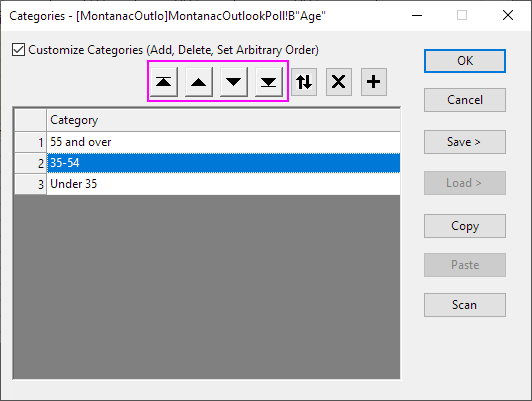
- On the MontanacOutlookPoll worksheet, highlight column B and right click to select Set As Categorical. Double-click on Unsorted in the Categories label row to open the Categories dialog box. Check Customize Categories (Add, Delete, Set Arbitrary Order) box. Then use the Move To Top
 , Move Up
  , Move Down
  and Move To Bottom buttons
  to reorder categories as "under 35", "35-54" and "55 and over":
- Repeat the same steps for column C so that the categorical mapping is <Female, Male>
- Repeat the same steps for column G so that the categorical mapping is <Better, Same, Worse>
Performing Cross Tabulation and Chi-square
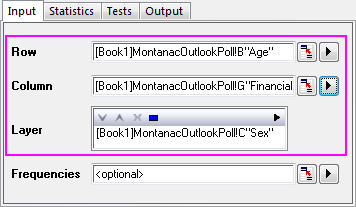
- Open the Cross Tabulation and Chi-square dialog by choosing the menu item Statistics: Descriptive Statistics: Cross Tabulation and Chi-square.
- Click on the Input tab. The data is in raw data mode, so select column B, G and C for Row, Column and Layer, respectively.
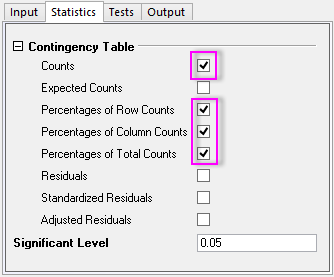
- Click on the Statistics tab, uncheck the Expected Counts, Residuals, Standardized Residuals and Adjusted Residuals and accept all the other default settings.
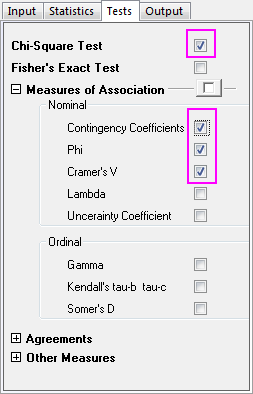
- On the Tests tab, select the Chi-Square Test check box. Expand the Measures of Association branch, and then select the Contingency Coefficients, Phi, and Cramer's V boxes (for measuring nominal association).
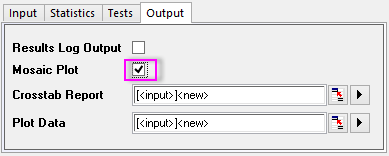
- Click on the Output tab and select the Mosaic Plot check box. Accept the other default settings and click OK.
Interpreting The Results
Go to sheet Crosstab1
Frequency Distribution
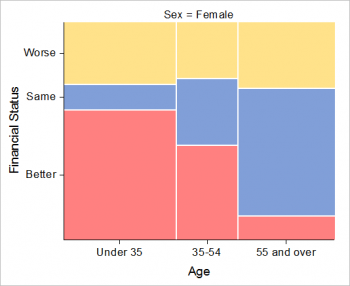
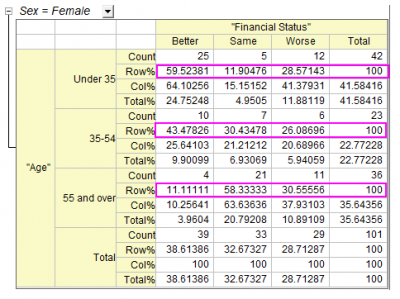
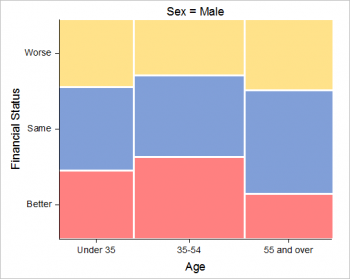
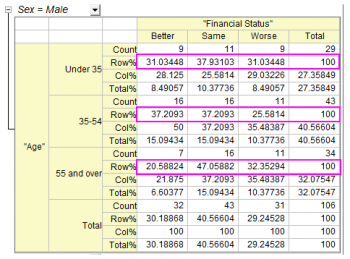
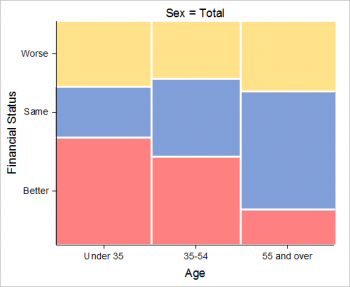
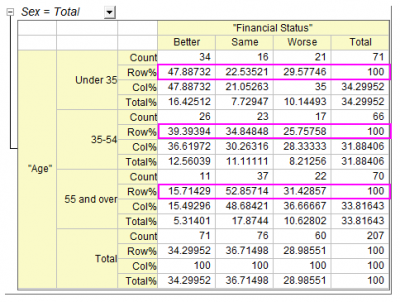
We can get frequency distribution information from the Mosaic Plot and the Contingency Table. The area of each rectangle in the Mosaic Plotis proportional to the percentage of the Y variable for each level of the X variable, so we can visually compare the frequency distribution of "Financial status" and "Age" for female, male and total. From the Contingency Table we can get more specific information. Combining the Mosaic Plot with Contingency Table, we learn:
- There is a major difference between younger and older women's views.
- A majority of women under 35, 59.5%, feel they have better financial status. A majority of women 55 and over, 58.3% think their financial status remains the same.
- Fewer women under 35, 11.9%, think their wealth status remains the same, while fewer women over 55, 11.1% think that they are better off financially.
- Compared to women, men's feeling for financial status shows another interesting pattern:
- Men show no significant difference in financial status between age groups.
- Men between 35 - 54 are a little more likely to be confident of their financial status.
- Regardless of the sex of respondents, there are some trends by age:
- People under 55 are more likely to be confident of their financial status
- People over 55 are more likely to feel that their financial status did not change.
Detecting Relationships Between Age and Financial Status
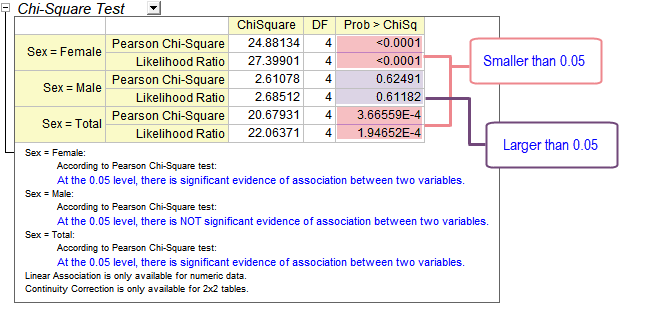
The Chi-Square Tests Table show test results for the independence of row and column variables.
If the Prob>ChiSq is less than 0.05, this means the row and column variables, in this case age and financial status, are significantly related. Note the conclusions in the footnotes beneath the table. We conclude that:
- Women of different ages differ in financial status.
- In contrast, there is no evidence to show an association between men's age and their financial status.
- Regardless sex, people of different ages usually differ in financial status.
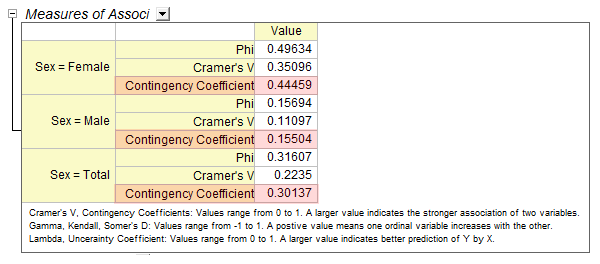
Assessing the Strength of the Relationship
The Measures of Association table helps in assessing the strength of the relationship between "Financial status" and "Age". As this is a 3*3 table(three levels for Age and three levels for Financial status), we can choose a Contingency Coefficient to compare across layers. (See the introduction page for the difference of the three statistics). From the table we can see
- Women's financial status shows a stronger association with age than is the case with men. (0.444 v.s. 0.155)