8.2 Use Data Cursor to Show the Difference between the Data
Compare-Data-by-DataCursor
Summary
In Origin, the Cursor tool is used to measure the X and Y distance between two points. You can place cursor objects on the same curve or on different curves, then use the Data Info window to display the relative positions of the cursor objects.
Minimum Origin Version Required: Origin 2019
 | There is also a Distance Annotation tool for adding and labeling a double-arrow between two points on the graph.
|
What you will learn
This tutorial will show you how to:
- Customize the Data Info window
- Read relative positions of two data points
Steps
- Start with a new worksheet.
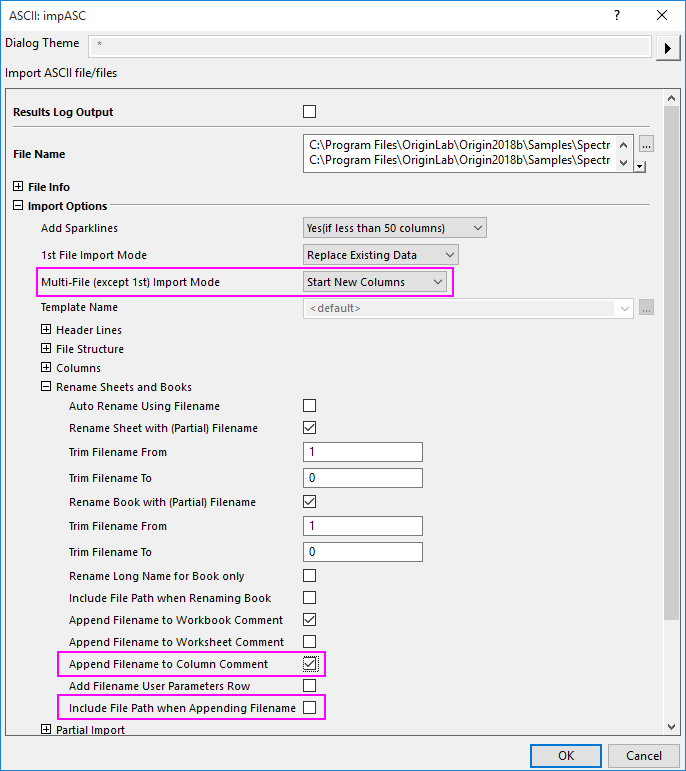
- Select File: Import: Multiple ASCII from the main menu. Go to the folder \Samples\Spectroscopy\Chromatography, select GPC Single Channel Chromatogram 1.dat and GPC Single Channel Chromatogram 3.dat. Click Add Files, make sure that Show Options Dialog is selected, and click OK. This opens the ImpASC dialog box. In this dialog, set the Multi-File Import Mode to Start New Columns, check the Append Filename to Column Comment check box and uncheck the Include File Path when Appending Filename check box in the Re(Naming) Worksheet and Workbook branch. Click OK to import these two files into a worksheet.
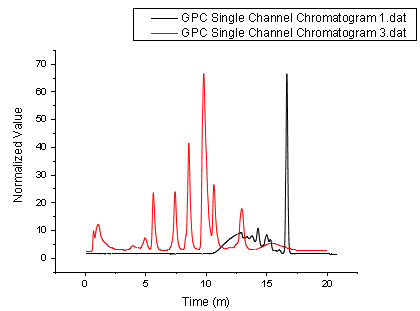
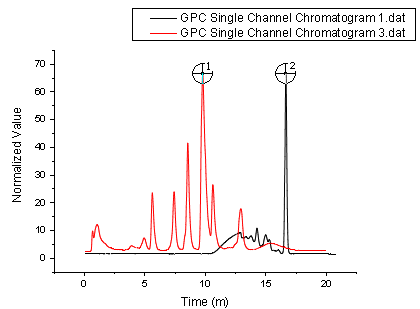
- Highlight all columns and right-click to select Set As: XY XY from the context menu. With all columns highlighted, choose Plot:Line:Line.
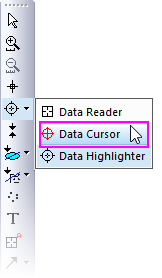
- Press and hold the Data Reader button and select the Data Cursor from the list.
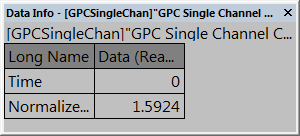
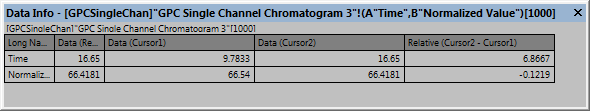
- The Data Info window opens.
- Right-click on the Data Info window and select Preferences... from the shortcut menu. This opens the Data Info Report Settings dialog box.
- Click the Add Column button three times to add a total of three columns to the Preview table.
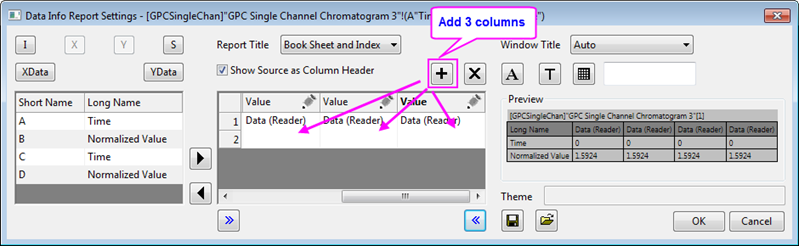
- Click the pencil icon
 above the first added column and change Source to Data (Cursor 1) and set Column Width = 30. Click OK.
- Click the pencil icon above the second added column and change Source to Data (Cursor 2) and set Column Width = 30. Click OK.
- Click the pencil icon above the third added column and change Source to Relative (Cursor 2 - Cursor 1) and set Column Width = 40. Click OK.
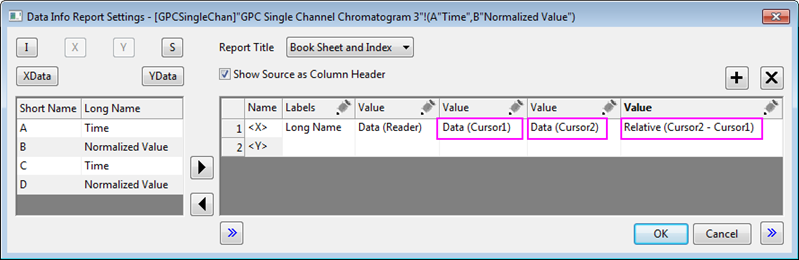
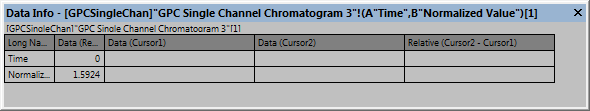
- Click OK to close this dialog. The Data Info window will display three new columns.
- Double-click on a data point in the graph to add the first cursor. Select the Data Cursor button again and add another cursor to the graph by double-clicking on the desired data point.
Note: After you add all the columns in the Data Info Report Settings dialog, you can save the settings as a Theme by clicking the Save Theme button  and choosing an option from the popup menu. Note that you can save settings to the graph (maximum portability) or to a named Theme file (and subsequently applied to any graph window). and choosing an option from the popup menu. Note that you can save settings to the graph (maximum portability) or to a named Theme file (and subsequently applied to any graph window).
|
- The Data Info window will be updated with the values of the two points and their relative values.
- Right-click the Data Info window and select Copy All from the shortcut menu, then paste the table into a clean worksheet as shown below.
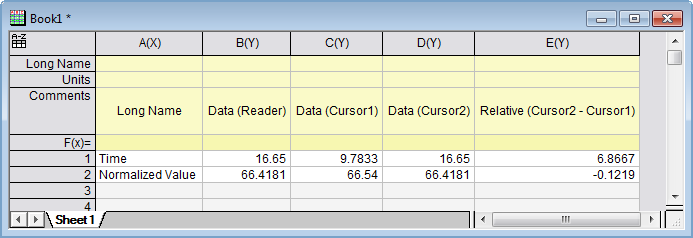
| You can promote any worksheet row to the column label rows (header) area by right-clicking on the row and choosing one of the Set As... or Append To... options.
|