6.17.2 3D Waterfall
3D-Waterfall
Summary
Origin features an OpenGL-supported 3D waterfall graph. The 3D waterfall is a specific type of 3D wall graph with a wall width = 0. You can rotate, resize, stretch and skew the graph as with other Origin 3D graphs.
What you will learn
This tutorial will show you how to:
- Plot a 3D waterfall graph
- Add a plane at the specified position in the graph
- Skew the 3D waterfall graph
Steps
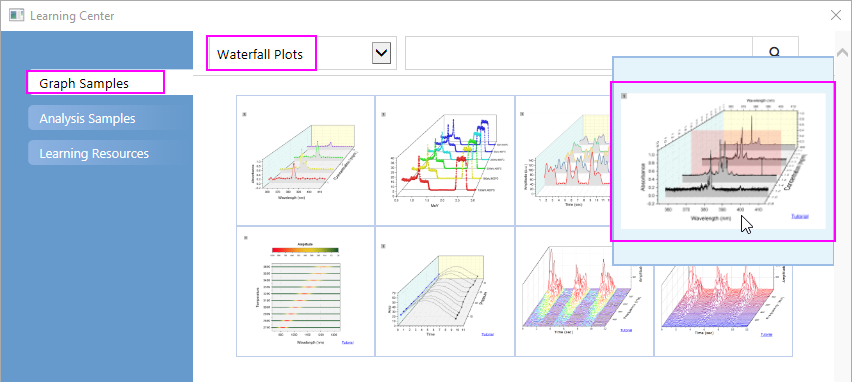
- Select Help:Learning Center menu to open Learning Center dialog. Select Graph Sample item in the left panel and then select Waterfall Plots for Samples in drop-down list. Double-click on the thumbnail below to open the sample Waterfall Plots - 3D Waterfall.
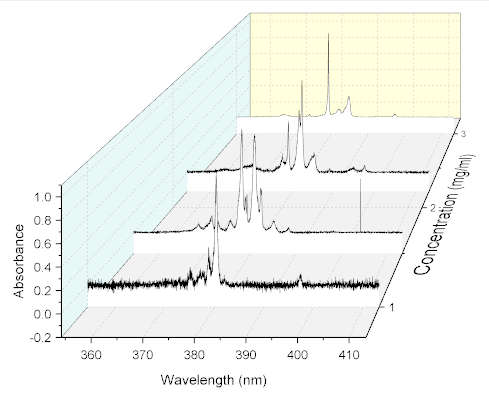
- Activate workbook Book4I, highlight all columns to select Plot > 3D : 3D Waterfall from the main menu to plot a 3D waterfall graph.
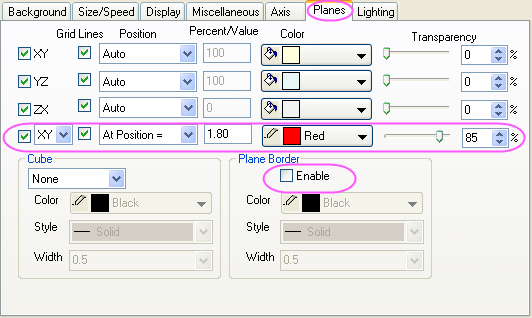
- Select Format:Layer from the menu to open the Plot Details dialog box. Go to the Planes tab, check the box to add an XY plane to the graph , uncheck the Enable check box in the Plane Border group, then set the remaining controls as shown in the following image:
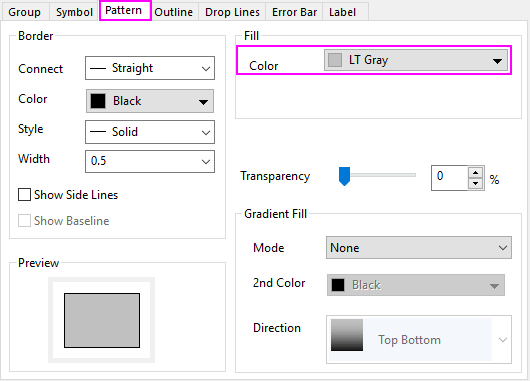
- Click the arrow icon to the left of Layer1 to show all plots in the layer. Select the first plot in the layer (take care not to clear the check box next to the dataset icon), then click the Pattern tab and set the Fill Color as LT Gray.
- Click OK to close the dialog box. Double-click on a graph axis to open the Axis dialog box. Clear the Use Only One Axis For Each Direction check box. Go to the Scale tab and select Z axis icon in the left panel and set From and To to 0.8 and 3.2, and set the increment value of Major Ticks to 0.2.

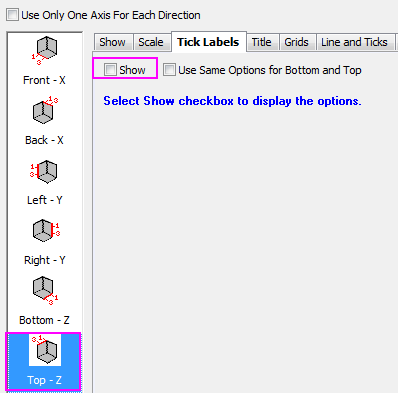
Go to the Tick Labels tab, make sure Top - Z icon is selected and clear the Show check box to hide the tick labels on top Z axis
- Go to the Line and Ticks tab, make sure Top - Z icon is selected and set Major Ticks and Minor Ticks to None.

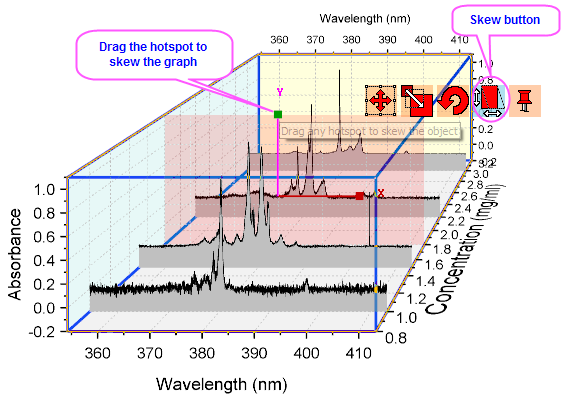
- Click OK to close the dialog. Click on the cube to activate the five red graphical editing icons. Click on the fourth button - the Skew button - and drag the X/Y hotspots to skew the graph in X/Y direction so that it looks approximately like this: