6.12.5 Creating Intersecting Surface Plots from Worksheets
3D-Surface-Intersect-VM
Summary
Many plot types, such as 3D Surface, 3D Bars, and Contour, can be created from data contained in a matrix object or from data arranged in a block of cells in a worksheet. The latter arrangement is referred to as a Virtual Matrix. Whereas a typical matrix object only supports a linear mapping of X and Y coordinates, a virtual matrix supports nonlinear mapping as well. In this tutorial, we show you how to create intersecting color map surface plots from virtual matrix data.
Minimum Origin Version Required: Origin 2015 SR0
What you will learn
This tutorial will show you how to:
- Create a Color Map Surface plot using virtual matrix data from a worksheet
- Add one surface graph to another to create intersecting surface plots
- Set transparency
Steps
Create Surface Plots from Virtual Matrix Data
This section will demonstrate how to create surface plots from data in a worksheet.
- Start a new project.
- Click the Import Multiple ASCII button
 on the Standard toolbar.
- In the dialog that opens, navigate to the \Samples\Graphing folder and select both VSurface 1.dat and VSurface 2.dat by holding down the Ctrl key and clicking Add File(s)
- Select the Show Options Dialog check box.
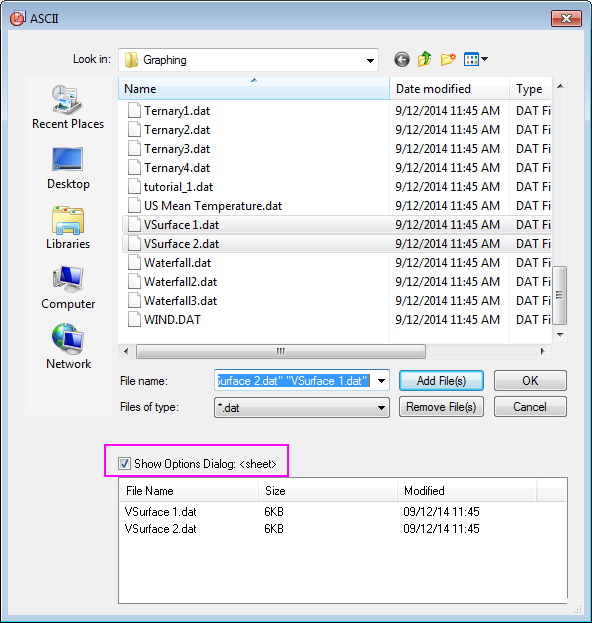
- Press the OK button.
- In the impASC dialog, modify the settings according to the following image, so that the two data files will be imported as two worksheets with name VSurface1 and VSurface2 in one workbook:
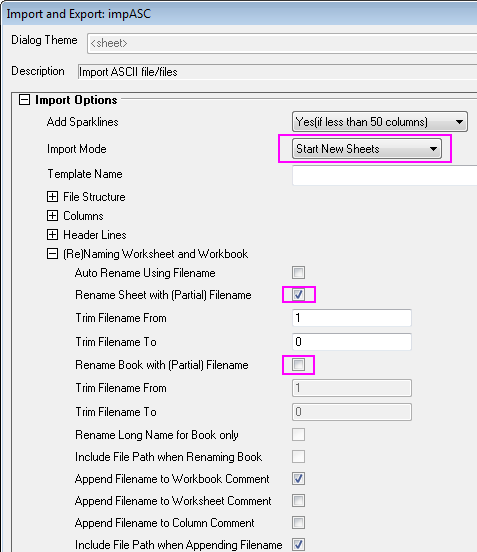
- Click OK to import these two data files.
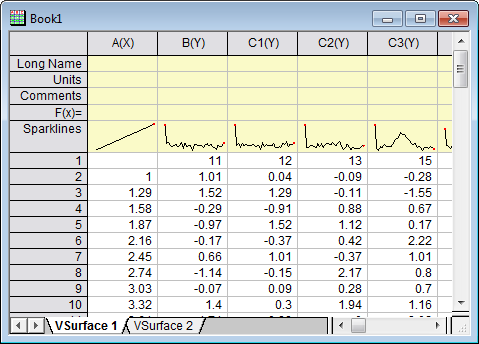
The data has X coordinate values in the top row and Y coordinate values in the first column. Note that the X coordinates have nonlinear spacing.
- With the "VSurface 1" sheet active, hover the cursor over the cell in the top left corner of the worksheet till it appears as a slanting black arrow and click to highlight.
.
- Select the menu item Plot > 3D :3D Colormap Surface to open the plotvm dialog.
- Note:This dialog opens every time a 3D or Contour plot menu item is invoked with a group of worksheet cells selected. The dialog allows you to define where the X and the Y coordinate values are located.
- In this dialog, adjust the settings as shown in the image below:
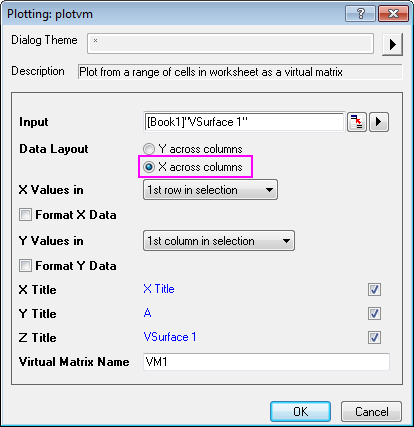
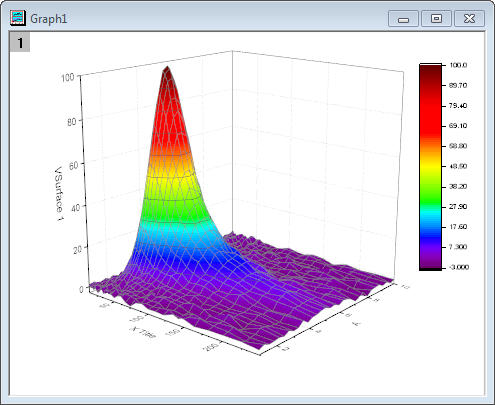
- Click OK to generate a Color Map Surface plot and a virtual matrix as shown below:
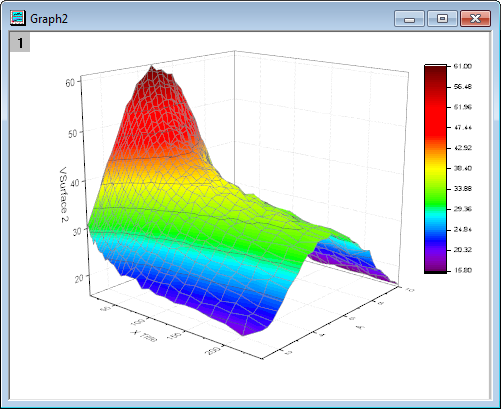
- Repeat the last step to plot another Color Map Surface plot using data from the VSurface 2 worksheet. This time VSurface 2 will be automatically used as Z title in the plotvm dialog.
Add Another Surface Plot to Layer
This section will demonstrate how to add a surface plot to a graph layer that already contains another surface plot.
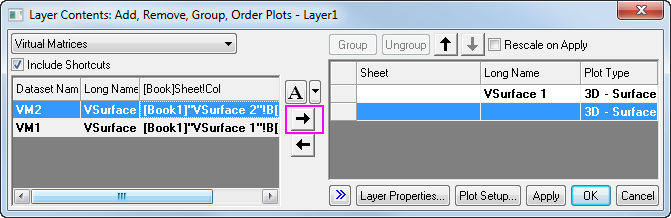
- Activate Graph1, right-click on the Layer 1 icon
 on the top left corner of the graph and select Layer Contents from the context menu.
- In the Layer Contents dialog that opens, select VSurface2 from the Available Data panel on the left and add it to the Layer Contents box on the right using the arrow that points to the right in the center of the dialog box (The arrow below it can be used to shift selected items from Layer Contents to Available Data).
-
Click OK to add the second surface, the graph will now appear as shown below:
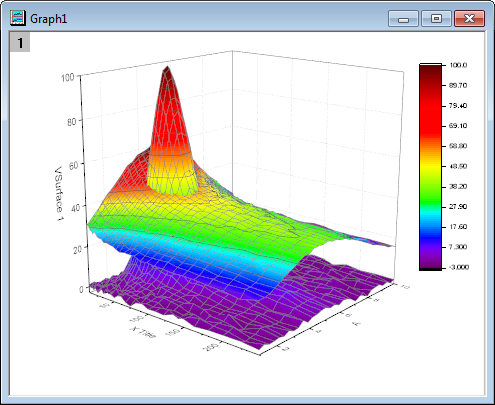
Note the two surfaces are displayed with proper intersection.
Set Surface Transparency
The next step is to set the transparency of the second surface so that parts of the first surface are visible in this intersection plot.
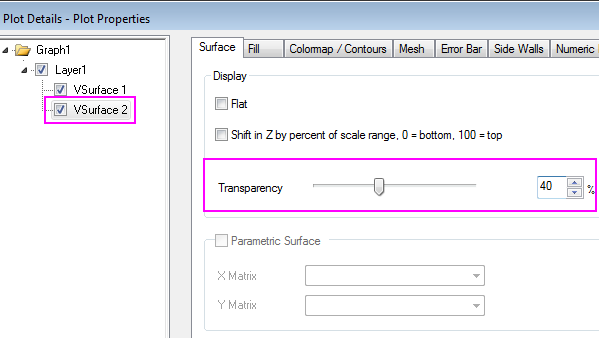
- Double click on the second colormap surface to open the Plot Details dialog.
- In the Surface tab, move the Transparency slider to 40% and click Apply, then OK.
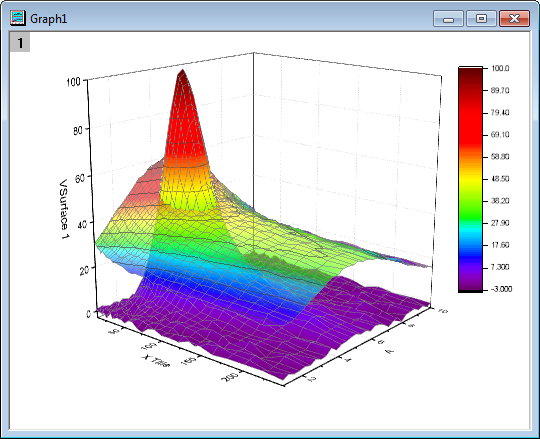
The completed graph should appear as the the image shown below: