6.12.7 Color Map Surface Graph
Contents
 
|
 
|
Summary
This tutorial will show you how to create a 3D color map surface.
What will you learn
This tutorial will show you how to
- Create a 3D color map surface graph
- Customize the 3D surface graph
Steps
- Select Help:Learning Center menu to open Learning Center dialog. Select Graph Sample item in the left panel and then select 3D Surface Plots for Samples in drop-down list. Double-click on the thumbnail below to open the sample 3D Surface Plots - Surface Graph profiling Differences in Body Heat Transfer.
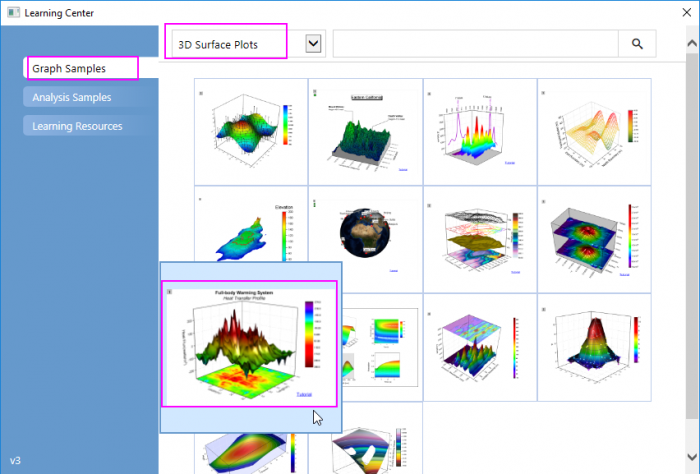
Note:This tutorial is associated with this Graph Galley page. - Highlight HFT data matrix and select Plot > 3D : Surface with Projection to create a 3D graph.
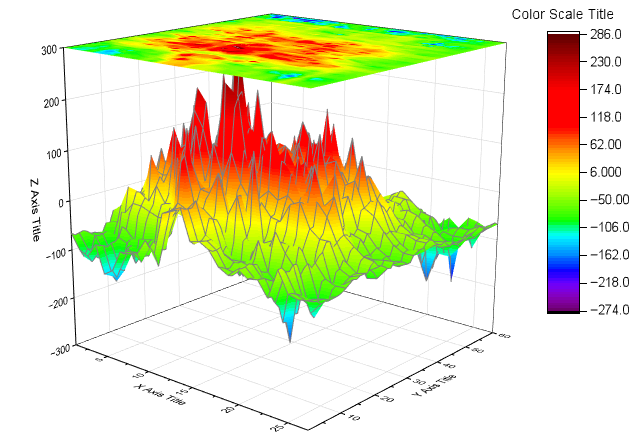
- Choose Format: Plot to go to the plot level of the Plot Details dialog.
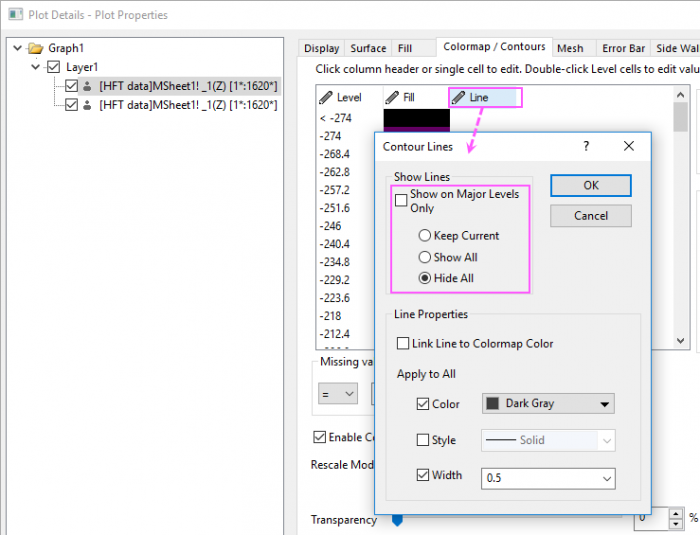
- Select the surface plot, go to the Mesh tab, uncheck the Enable box to turn off the mesh lines. Go to Colormap/Contours tab, click Line title to open the Contour Lines dialog. In this dialog, uncheck Show on Major Levels Only and select Hide All to hide all contour lines.
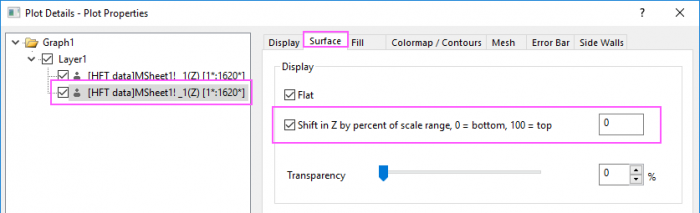
- Select the projection plot in the left panel, go to Surface tab, Enter 0 as the following image shows to put the projection to the bottom of the graph.
- Go to Colormap/Contours tab, hide all contour lines like the step4 does.
- Click Layer 1 in the left panel, and then in the right panel select the Lighting tab. Change the setting as following to enable lighting effect:
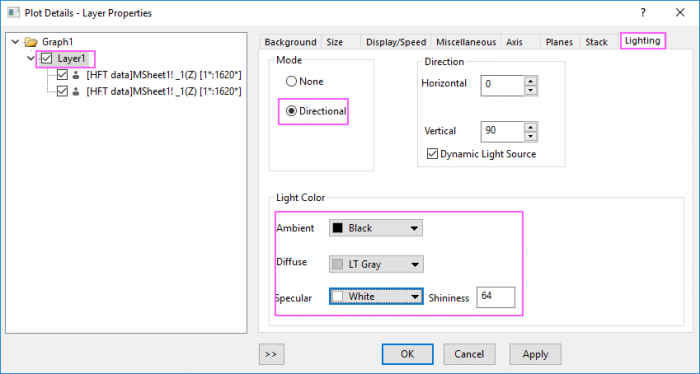
Then Click OK to close the dialog. - Finally, change axis titles and add a graph title as the following graph.
