6.17.1 2D Waterfall
2D-Waterfall
Summary
Origin's Waterfall plot uses a dataset stored in a parameter row to set the Z offset and create a color map with Y or Z values.
What you will learn
This tutorial will demonstrate how to:
- Create a 2D Waterfall color map with Y or Z values
- Customize colormap levels and palette
Steps
Create Waterfall with Y Colormap
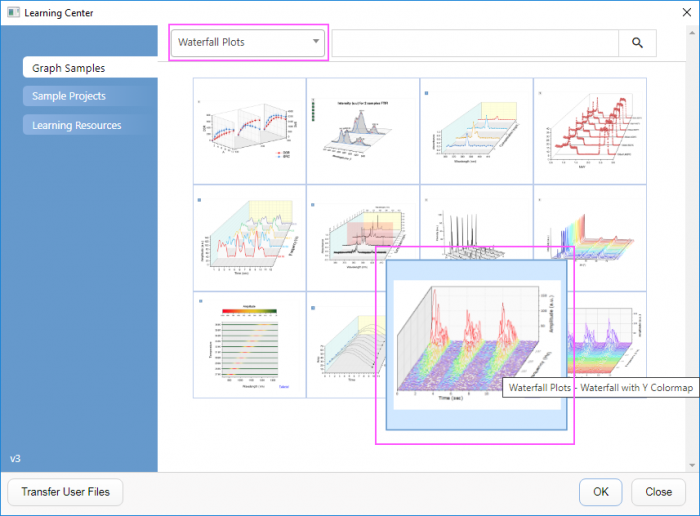
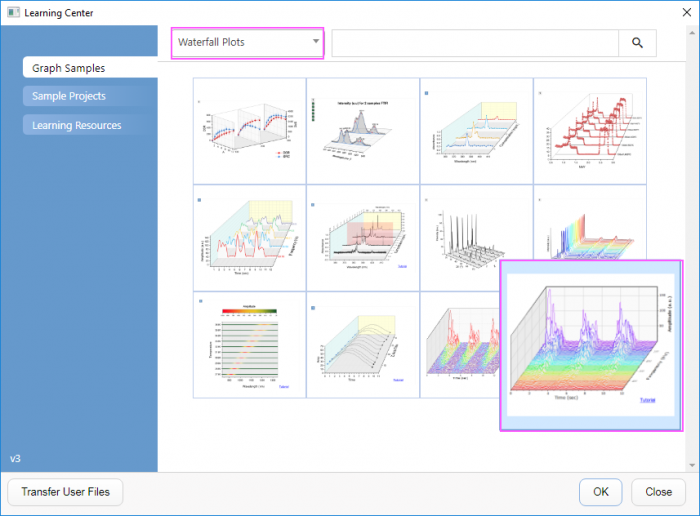
- Open the sample project "Waterfall Plots - Waterfall with Y Colormap" under category "Waterfall" in Learning Center(pressing F1 to open it).
- Select the Waterfall with Y Colormap window to activate it. Click in the upper left corner of the worksheet to select all data.
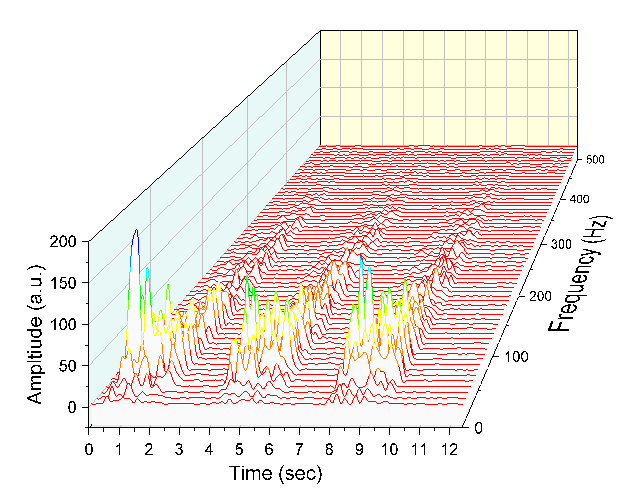
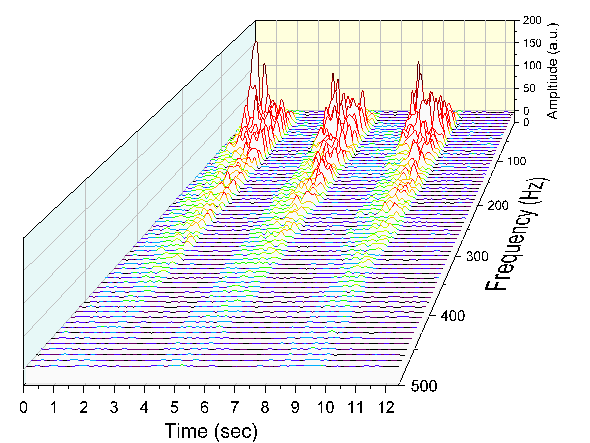
- Right-click and select Plot > 3D : Y Color Mapped 3D Waterfall to create a Waterfall with Y color mapping. (Alternatively, select the Y Color Mapped Waterfall button from the 2D Graphs toolbar.) A graph resembling the image below will appear:
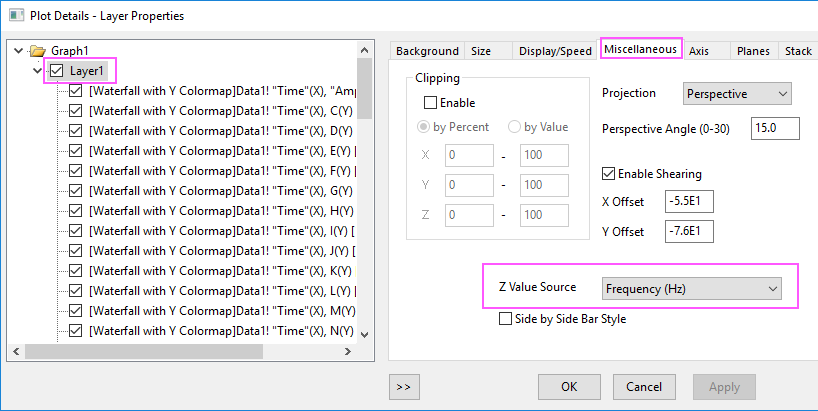
- Note that the values stored in the user-defined parameter row Frequency (Hz) have been automatically picked up as Z Value Source. Confirm this by double-clicking the plot to open the Plot Details dialog box and selecting Layer1 in the left panel. Select the Miscellaneous tab and observe that the Z Value Source is set to Frequency (Hz).
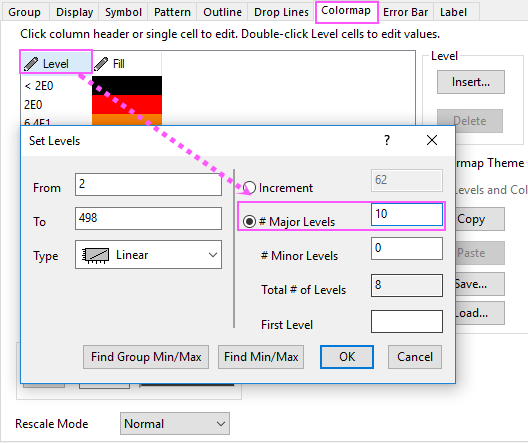
- With the Plot Details dialog box still open, in the left panel, select the first line plot under Layer1. Select the Colormap tab in the right panel. Click on the Level… column header to open the Set Levels dialog box. Set levels as shown below:
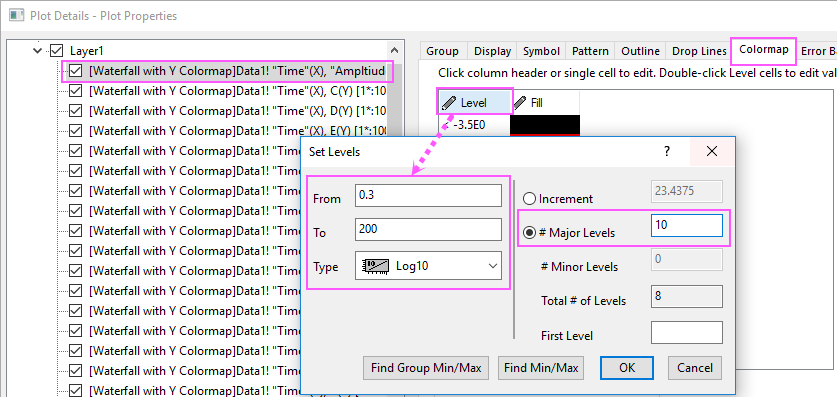
- Click OK to close the Set Levels dialog box.
- Click on the Fill… column header to open the Fill dialog box. Select Load Palette, and choose the Rainbow palette from the palette list. Click OK button to close the Fill dialog box.
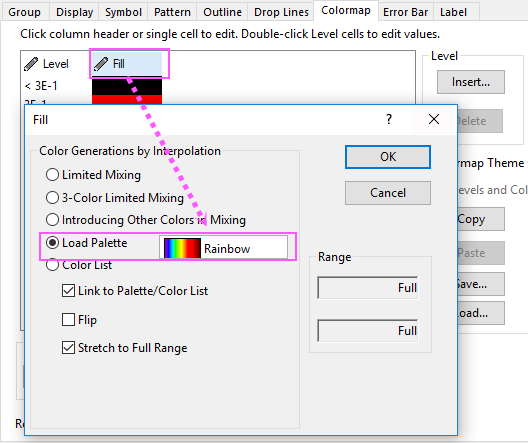
- Click OK to apply these settings and close the Plot Details dialog box.
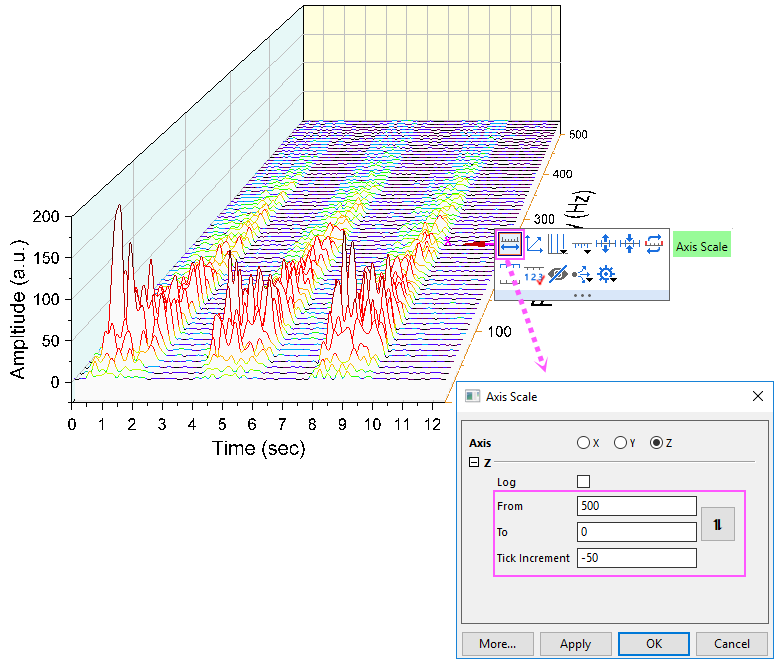
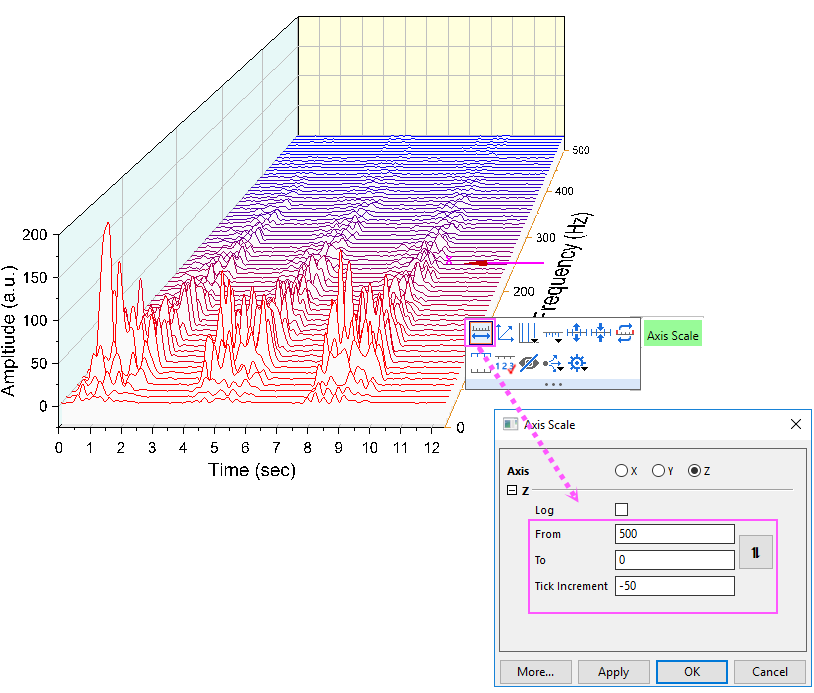
- Click on Z axis, on the popup mini toolbar, click button Axis Scale to open the Axis Scale dialog box. Set From, Toand Increment as below.
- Click Y axes, on the popup mini toolbar, click button Show Opposite Axis to show the Y axis on the other side.
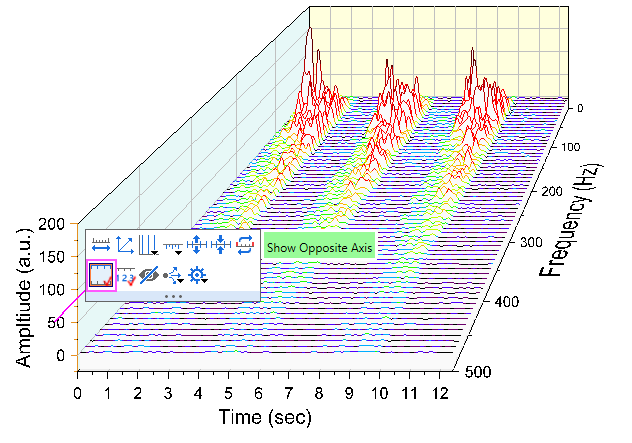
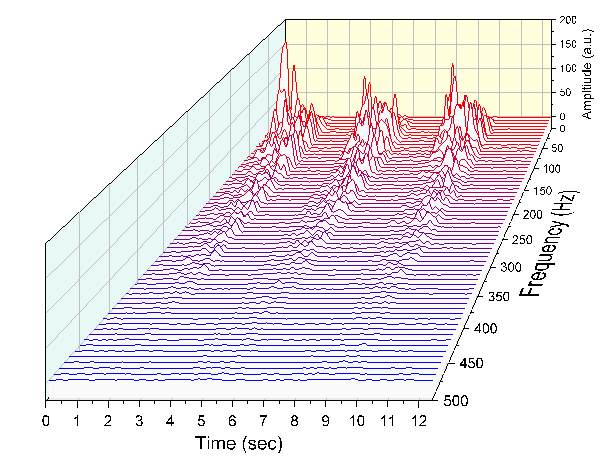
- Click OK to apply changes and close the dialog box. The final graph should look like this:
Create Waterfall with Z Colormap
- Open the sample project "Waterfall Plots - Waterfall with Z Colormap" under category "Waterfall" in Learning Center(pressing F1 to open it).
- Select the Waterfall with Z Colormap window to activate. Click in the upper left corner of the worksheet to select all data.
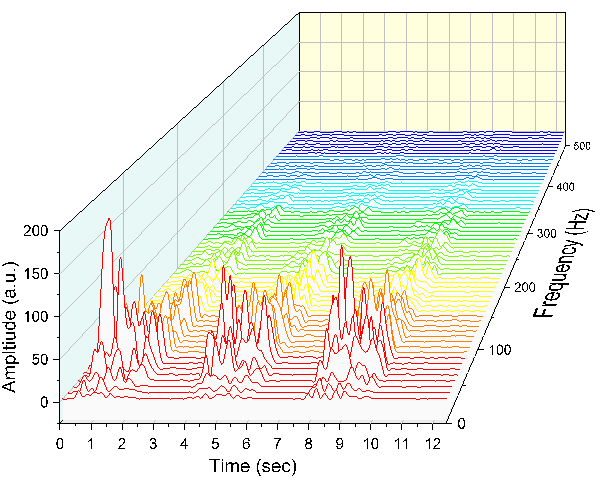
- On the main menu, click Plot, then point to 3D, and then select Z Color Mapped 3D Waterfall to create a Waterfall with Z color mapping. (Alternatively, select the Z Color Mapped Waterfall button from the 2D Graphs toolbar.)
- Double-click the plot to open the Plot Details dialog box. In the left panel, select the first line plot under Layer1. Select the Colormap tab in the right panel. Click the Level… column header to open the Set Levels dialog box. Set Major Levels to 10.
- Click OK to close the Set Levels dialog box.
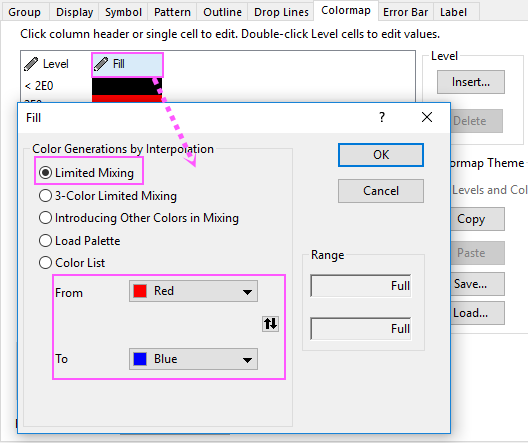
- Click the Fill… column header to open the Fill dialog box. Select Limited Mixing and set the From color to red and the To color to blue. Click OK to apply these settings and close the dialog box. Click OK to close the Plot Details dialog box.
- Click on Z axis, on the popup mini toolbar, click button Axis Scale to open the Axis Scale dialog box. Set From, Toand Increment as below.
- Click Y axes, on the popup mini toolbar, click button Show Opposite Axis to show the Y axis on the other side.
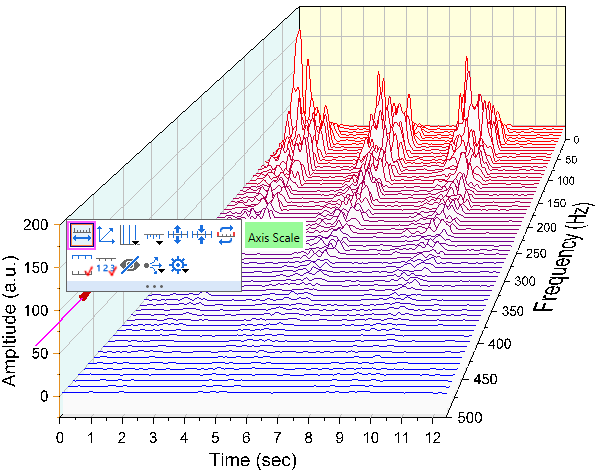
- Your final graph should look like this: