5.3.1 One Way ANOVA
1WayANOVA
Summary
Statistics has two modes of data input; indexed and raw. When a statistical analysis is performed, there is usually no need to use an entire data set; Origin provides several methods of data selection. For example, the interactive Regional Data Selector button can be used in the graphical selection of data, or the Column Browser dialog can be employed to make the selection.
In this tutorial, you will learn how to use the two methods of data input so that the Analysis of Variance (ANOVA) statistical test can be performed.
ANOVA is a parametric method for means comparison of several groups, and it is also an extension of two independent sample t-tests. ANOVA is more powerful than multiple t-tests since it controls the chance to commit type I error better when the number of groups is relatively large. For example, when comparing the means among 5 groups using a t-test, ten multiples of the t-test, each with a significance level of 0.05, are performed, resulting in an overall chance to commit type I error of 1-(1-0.05)^10=0.401. Under the same circumstances, the chance to commit type I error in ANOVA is 0.05.
ANOVA requires normality and equal variance. If these requirements are not met, non-parametric analysis should be used.
Minimum Origin Version Required: Origin 2016 SR0
What You Will Learn
This tutorial will show you how to:
- Use different input data modes in the statistical analysis dialog
- Do normality tests
- Perform one-way ANOVA
Steps
Origin can perform ANOVA from an indexed data mode, or from a raw data mode.
When an indexed data mode is used, the data needs to be organized in a factor column and a data column.
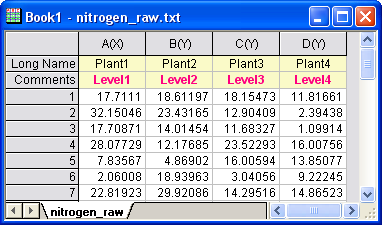
When a raw data mode is used, the data needs to be organized with different levels in different columns.
Indexed Data Mode
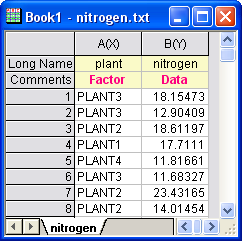
Nitrogen content, in milligrams, has been recorded for 4 kinds of plants. We are interested to know whether different plants have significantly different nitrogen content. As a result, we will use the index data mode in One-Way ANOVA analysis.
- Start with a new workbook and select Help: Open Folder: Sample Folder... to open the "Samples" folder. In this folder, open the Statistics subfolder and find the file nitrogen.txt. Drag-and-drop this file into the empty worksheet to import it.
- Next, we perform a normality test on each group of data to determine whether it follows a normal distribution. Highlight the first column of the workbook and from the Menu Bar, select Worksheet: Sort Worksheet: Ascending.
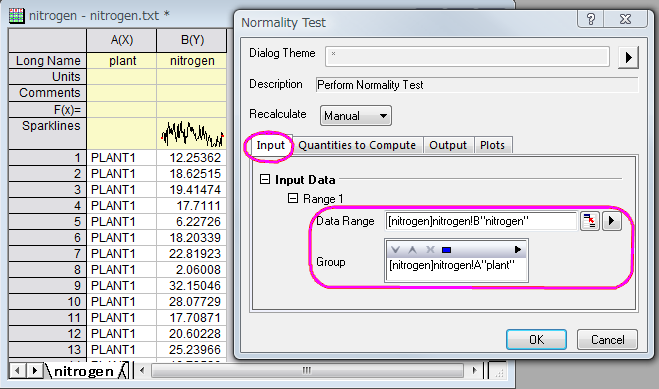
- From the Menu Bar, select Statistics: Descriptive Statistics: Normality Test: Open Dialog. In the Normality Test dialog, in the Input tab, expand Input Data and Range 1. Press the triangle button at the right of Data Range and select B(Y): nitrogen, then press the triangle button at the right of Group and select A(X): plant. Click OK.
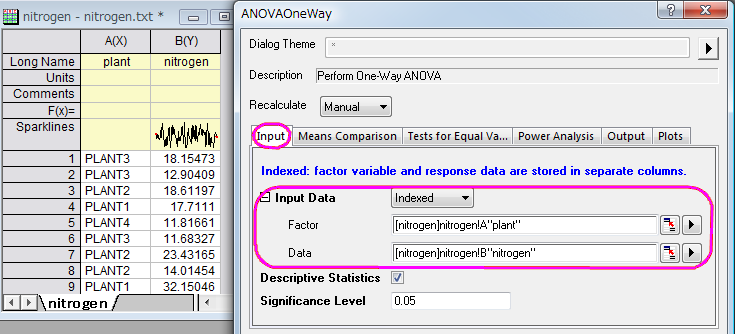
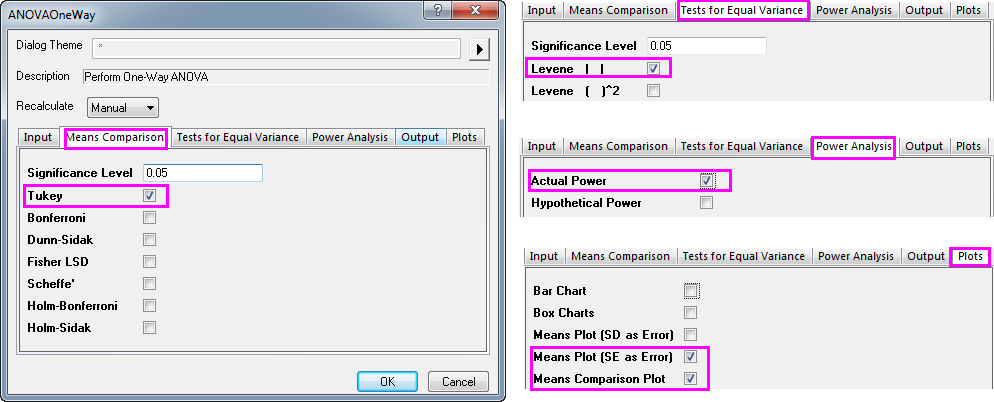
- With the nitrogen worksheet active, go to the Menu Bar and open Statistics: ANOVA: One-Way ANOVA.... In the ANOVAOneWay dialog box, in the Input tab, set Input Data to Indexed. Pressing the triangle button at the right of Factor, select A(X): plant and pressing the triangle button at the right of Data, select B(Y): nitrogen.
- In theMeans Comparison tab, check the Tukey check box; In the Tests for Equal Variance tab, check the Levene check box; In Power Analysis tab, select Actual Power check box; In the Plots tab, check the Means Plot[SE as Error] and the Means Comparison Plot check boxes. Click OK.
Result Interpretations
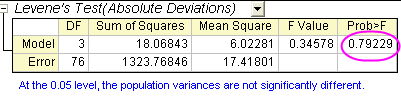
- On the ANOVA1Way1 report sheet, you will see a Homogeneity of Variance Test node. If results are not visible, click to expand the node. Because the p-value is greater than 0.05, the four groups are considered to have equal variance.
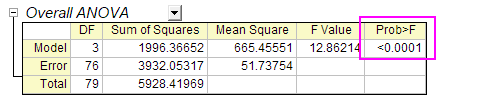
- The ANOVA table (Overall ANOVA) reports a p-value that is smaller than 0.05, hence at least two of the four groups have significantly different means.
- Expanding the results of "Means Comparisons" reveals further information regarding relationships between groups.
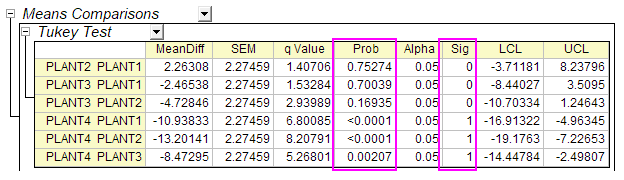
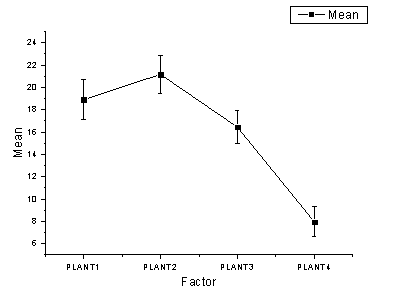
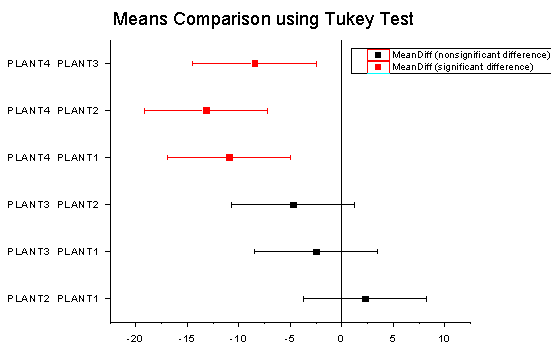
- Here we see that the mean of PLANT4 differs significantly from the other three groups. Looking at the Means Plot and Means Comparison Plot, we can see that PLANT4 has the smallest mean and is significantly different from the other three groups.
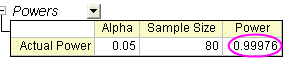
- In the "Powers" table, Actual Power=0.99976, that is, the chance of a Type II error occurring is almost equal to zero.
Raw Data Mode
- Start with a new workbook and select Help: Open Folder: Sample Folder... to open the "Samples" folder. In this folder, open the Statistics subfolder and find the file nitrogen_raw.txt. Drag-and-drop this file into the empty worksheet to import it.
- Choose Statistics: ANOVA: One-Way ANOVA.
- On the Input tab, set Input Data to Raw, then set Number of levels to 4.
- Click the browse button
 to the right of Data and choose Select from Worksheet. The dialog box rolls up.
- Select all four columns (Plant1, Plant2, Plant3, Plant4) and on the rolled-up dialog box, click Done. Click OK to perform the ANOVA.
- Examine the analysis results and you will see that we reach the same conclusions as we did when using Indexed data mode.
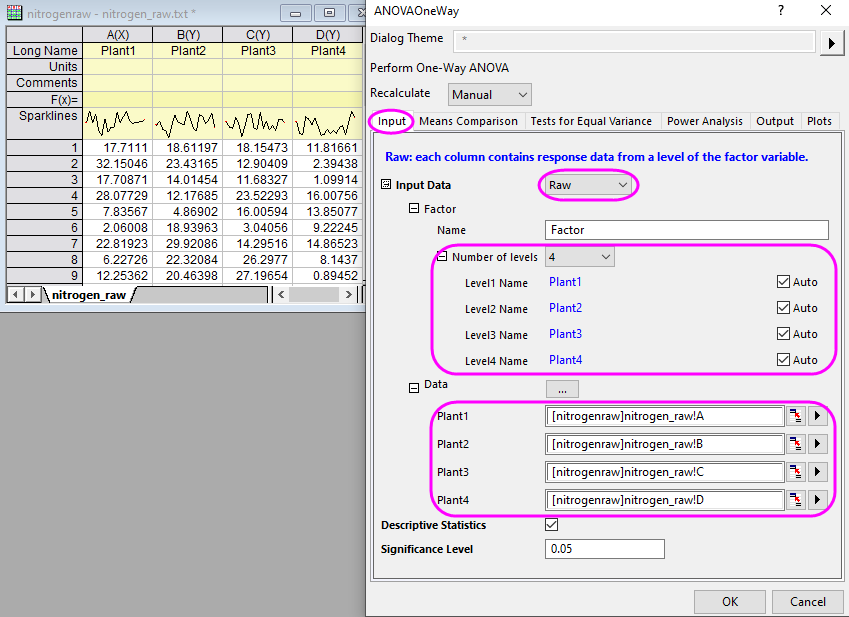
 | If the Level Name is set to Auto, it will follow the column long name of the selected data.
|