1.246 FAQ-1035 Why there is additional line on my column graph? How can I turn it off?
Last Update: 9/28/2020
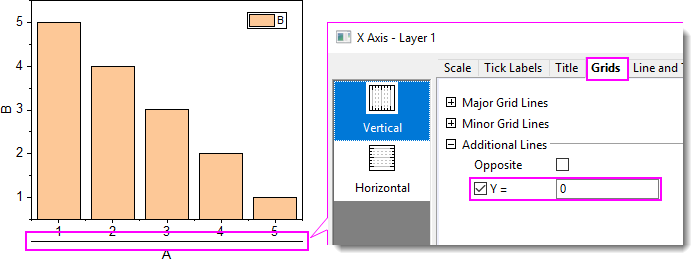
Column chart grows up from Y = 0 by default. If you rescale the Y axis range not to start from 0, you will see an additional line at Y = 0. To turn off this line,
- Double click on the Y axis to open the Axis dialog.
- Activate Grid tab. Uncheck "Y=" under Additional Lines.
Tips: if you want your column/bar plot starts from the axis line rather than additional line, please refer to this page.
Keywords:bar, bottom line, bottom axis line, column, additional line