1.315 FAQ-1240 How to sort the columns/bars by Y-value in ascending/descending order without changing the source data?
Last Update: 5/29/2026
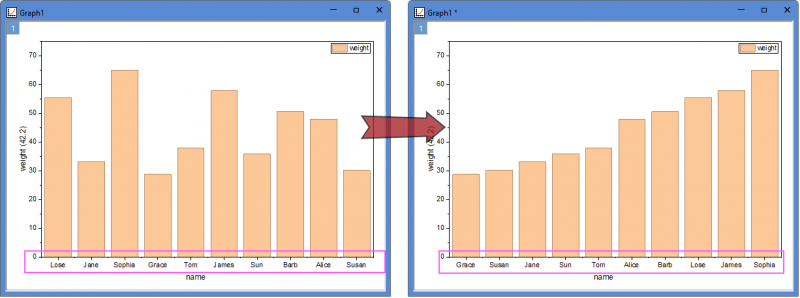
When you created a column chart with auto X or text X, you might want to sort the columns by Y values in ascending descending order:
You can follow the steps below:
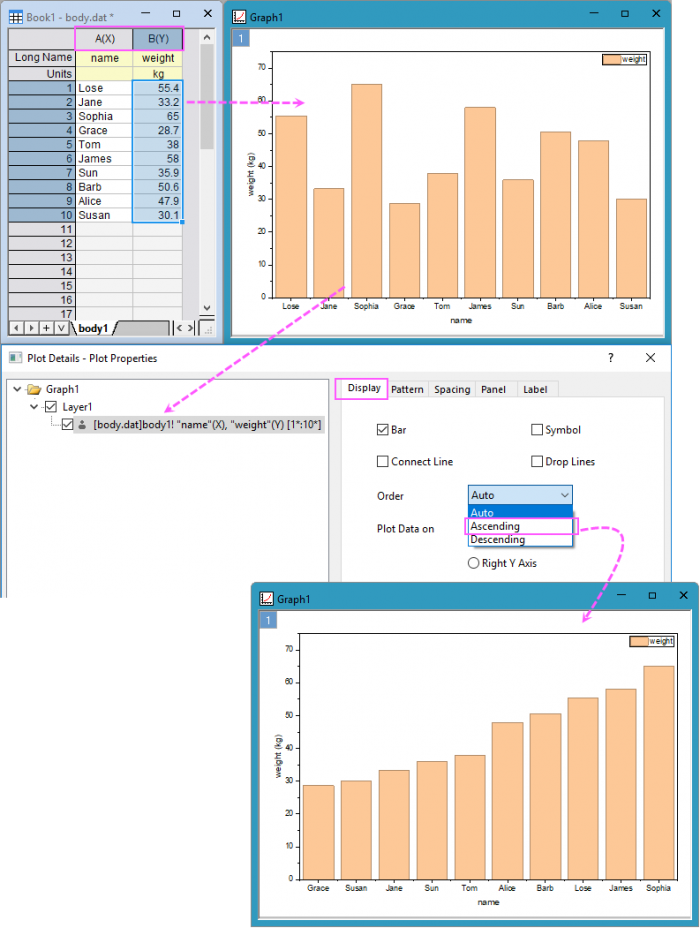
- Make sure that the X data has been designated as X; then plot a column chart from Plot menu
- Double-click on the graph to open the Plot Details dialog: select the column plot in left panel and go to Display tab in right panel; choose Ascending or Descending from the Order drop-down list to sort the columns.
Sometimes, if the display of X tick labels has been set to Tick-indexed dataset, not Text from dataset(generally by default from "Column/Bar" template), which means the tick labels are not matched to Y values but just indexed, when you use the Order drop-down list above, the order of tick labels will not change along. Then, please change the Display Type of tick labels for X axis to Text from dataset.
Keywords:Sort bars, sort columns, tick label order, change the order