3.140 FAQ-837 如何将数据划分为区间,并分别计算每个区间的数据总和?
Last Update: 11/27/2024
如果你想将数据划分为区间,并分别计算每个区间的数据总和,首先你可以通过为数据设置分组号,对数据进行分组,然后对分组进行统计。
假设 A 列中的数据为1到20,你可以按照以下步骤:
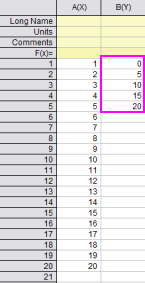
- 添加一个新列 B 列, 并在 B 列 中输入每个区间终点值。
例如,如果你想分组数据的区间为 [0, 5), [5, 10), [10, 15) 和 [15, 20),你可以在 B 列 的每一行中输入 0, 5, 10, 15 和 20。 - 添加一个新列 C 列, 并设置长名称为 GroupNumber。
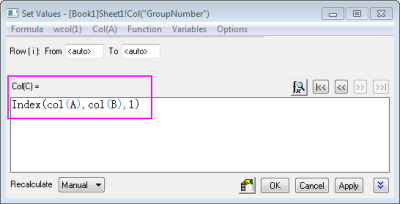
- 选中 C 列, 然后右键单击并选择 Set Column Values…,打开 Set Value 对话框。
- 在 Column Formula 编辑框,输入
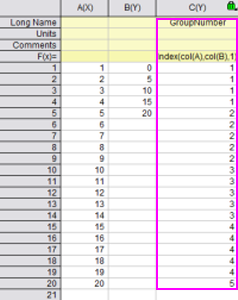
Index(col(A),col(B),1)Note: 想了解更多关于函数 Index,请参考LabTalk Guide。 - 点击 OK 按钮,分组号将会显示在 C 列。
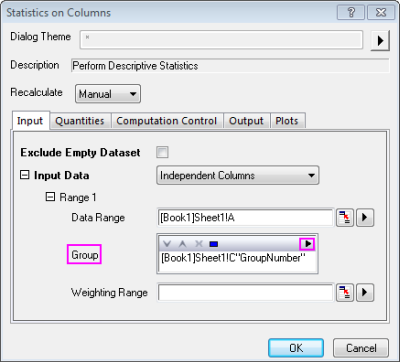
那么, 分组号1 表示在区间 [0, 5) 的数据点,分组号2 表示在区间 [5, 10) 的数据点,如此类推。 - 选中 A 列,然后在 Origin 菜单中选择 Statistics: Descriptive Statistics: Statistics on Columns,打开 Statistics on Columns 对话框。
- 点击在对话框中 Group 项的三角按钮,在弹出菜单中选择 C 列。
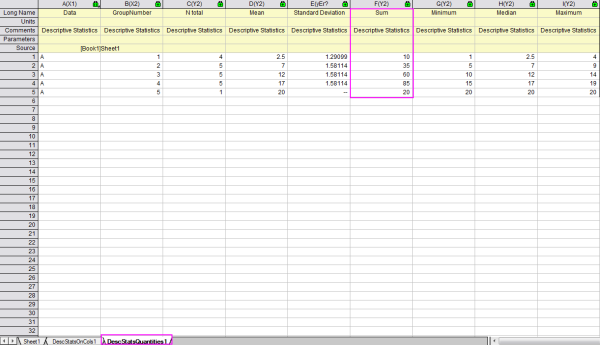
- 点击 OK 按钮,每个区间的总和将会输出到结果表 DescStatsQuantities1 中。
Keywords:Sum, Index, Set column values, Descriptive statistics,总和,索引,设置列值,描述统计