1.170 FAQ-833 How to plot with virtual matrix?
Last Update: 2/18/2019
In Origin, you can create a contour or 3D graph from a range of cells in a worksheet, which is treated as a virtual matrix.
You have the following two options to customize data when you plot a graph from a virtual matrix:
1. Creating a virtual matrix
In this scenario, you can make a plot as well as create a virtual matrix:
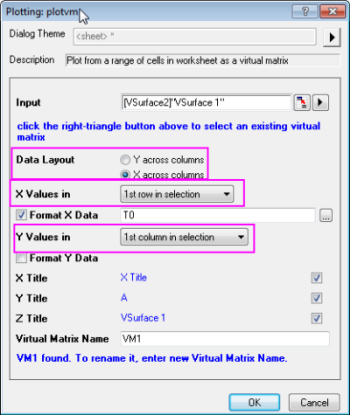
- Select the worksheet cells block, and then click the Plot menu, such as Plot > 3D : 3D Colormap Surface or another graph types that support creation from virtual matrix, to open the Plotting: plotvm dialog.
- Select a way to set X values and Y values for the graph in Data Layout item.
Note: If the radio of Y across columns is selected, it means that it will use the values in a row as the Y-values and the values in a column as the X-values. Conversely, if the radio of X across columns is selected, it means that it will it will use the values in a row as the X-values and the values in a column as the Y-values.
- Select the X and Y data range from the drop down lists of Y value in and X value in.
Note: If None is selected in the drop down list, row index or column index will be X or Y data when creating virtual matrix.
- Click OK button, a virtual matrix will be created with the plot.
2. Selecting an existing virtual matrix
In this scenario, you can use an existing virtual matrix to make a plot:
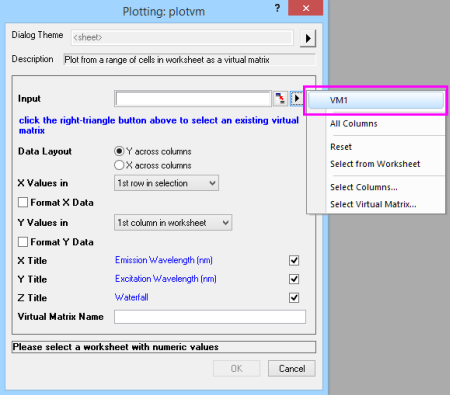
- Click the Plot menu to open the Plotting: plotvm dialog.
- Click the triangle button
 in Input item, and then select an existing virtual matrix in the fly-out menu.
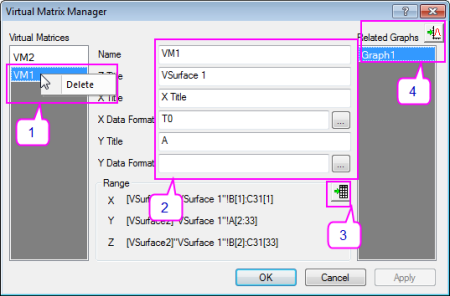
You can use Virtual Matrix Manager to manage the existing virtual matrices. If you want to launch the Virtual Matrix Manager dialog, you can select Tool: Virtual Matrix Manager… from Origin menu or double click on any plot created by virtual matrix to open Plot Details dialog, and then click Workbook button at the bottom. In Virtual Matrix Manager dialog, you can:
|
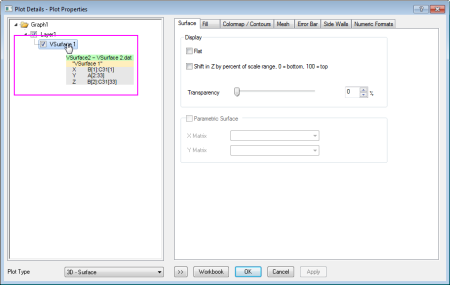
You can get the range of virtual matrix easily in Plot Details dialog after creating a plot from a virtual matrix:
|
In Origin, the virtual matrix can be also accessed and changed the properties by vmatrix object in Labtalk. |
Keywords:Virtual matrix, 3D graph
Minimum Origin Version Required: Origin 2015