3.43 FAQ-275 How do I hide the analysis markers and locks?
Last Update: 3/26/2026
How to Hide Analysis Markers
When you select data sub-range to perform analysis using Data Selector  , analysis markers will be generated.
To hide or change the size of analysis markers, you have four different ways:
- right-click on current layer (do not select the layer) to select Analysis Markers from shortcut menu.
- right-click on the analysis markers to select Analysis Markers from shortcut menu.
- left-click on the lock icon to select Analysis Markers from shortcut menu.
- select Data: Analysis Markers from main menu.
How to Hide Green Analysis Locks
When you do an analysis on graph, or plot a data with is an output of some analysis, a green lock shows in graph to show current mode for recalculation. The lock will not be exported or printed but still sometimes it's in the way.
We can hide the recalculation locks on the activated graph with the button“Show Locks”on page-level mini toolbar;
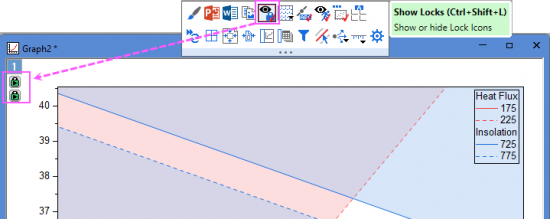
Or select View: Show: Lock Icons menu.
To turn off the recalculation locks globally:
- Choose View: Show: Hide Lock Icons for All Graphs menu to open a dialog:
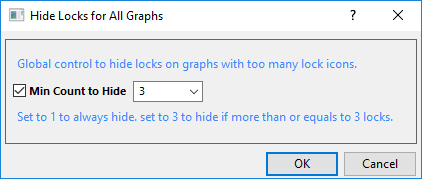
You can enter a numerical value; when the number of lock icons in a graph exceeds this value, all lock icons within that graph will be automatically hidden.
Keywords:pink, delete, arrow, magenta, purple, plots, data, lock