1.243 FAQ-1026 How to create a zoom plot for 2D graph?
Last Update: 11/23/2025
Origin provides 3 methods to create a zoom plot for 2D graph.
Compare of 3 methods
| Work for multi-layer graph? | zoom graph can auto-update after inserted to source graph? |
Start from | |
|---|---|---|---|
| Method 1: Ctrl + Zoom to select region on graph and then copy layer | Y | N | Worksheet |
| Method 2: Zoom Inset App | Y | Y | Graph |
| Method 3: Zoom plot type from Plot menu | Y | Y | Graph |
Method 1: Ctrl + Zoom to select region on graph and then copy layer
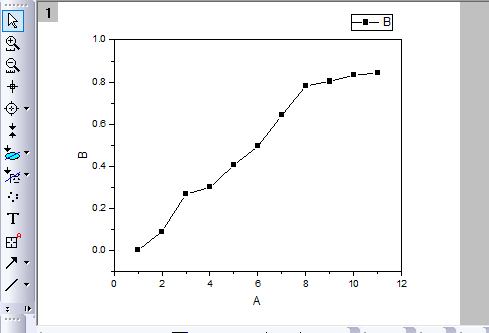
- With the graph window activate, click the Scale In button
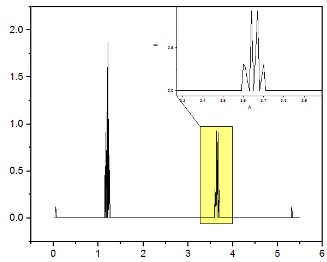
 (on Tools toolbar docked at the left-hand side of the workspace). Press Ctrl key and drag out a rectangle area on the graph. It will create an enlarged graph. Moving the rectangle box in the source graph will update the enlarged graph dynamically.
 - On the enlarged graph, right click on a blank place inside the layer and select Copy. Go to the source graph and click Ctrl + V to paste it.
Method 2: Zoom Inset App
You can download Zoom Inset App from File Exchange page.
Method 3: Zoom plot type from Plot menu
Origin provides a build-in zoom graph template. You can access it by selecting menu Plot: Multi-Panel/Axis.
Keywords:zoom graph, insert panel, enlarge part