1.65 FAQ-187 How can I create a heatmap?
Last Update: 11/19/2024
Origin supports plotting XY data, XYZ data or matrix data as heatmap and 4 built-in heatmap graph templates Heatmaps, Heatmaps with Labels, Split Heatmaps are available from Plot: Contour menu and 3D Stacked Heatmaps from Plot: 3D menu.
There are also extra heatmap templates such as Triangle Heatmap and Heatmap with Significant Mark online for download from Tools: Template Center...
When plotting from XY columns or XYZ columns, 2D binning is done on XY data to calculate statistics quantities e.g. counts, mean, max, etc. in each bin to create a Heatmap worksheet. The heatmap graph is created based on the new Heatmap sheet.
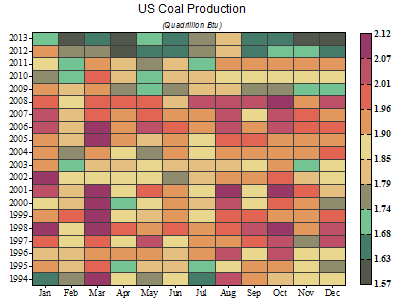
To adjust axis tick labels
- If tick labels are too dense, e.g. in case of too many bins, double click on axis and go to Scale tab.
- Set Major Ticks Type to be By Increment or By Counts and set the increment value or number of counts.
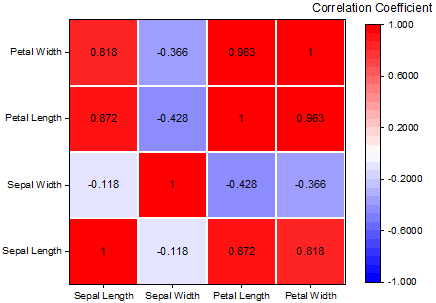
To add labels on heatmap
- Click on heatmap and use mini toolbar button to turn on label on heatmap.
- Open Plot Details dialog. Go to Labels tab to specify what to show as label.
To add map on background
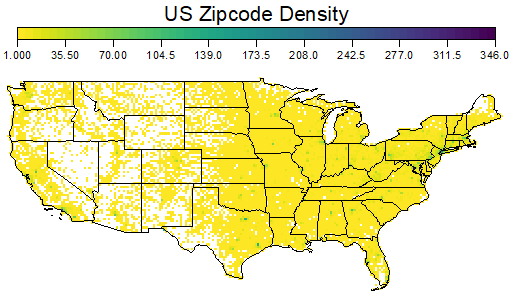
If XY is longitude and latitude, there are several ways to add map on background.
- choose Insert menu to see if some built-in maps are available, e.g. Continental US Map or World Map, etc.
- Use Origin's Map Online app to insert map as background.
- Use Origin's [Google Map Import app to insert google map as background.
- Use Shapefile connector to import shapefile and draw shapefile as background.
- To set graph to be isometric, Alt+click in graph and click Isometric mini toolbar button.
To add gap between in heatmap cells
- Click on heatmap and turn on gap between heatmaps and adjust the thickness.
- Open Plot Details. Go to Display tab to adjust gap in X and Y directions.
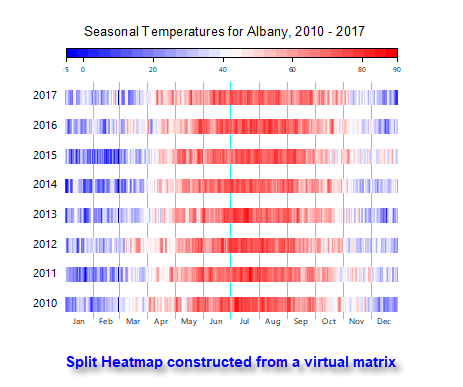
- When plotting by Plot: Contour: Split Heatmap, gaps are added horizontally automatically.
More resources:
- Learning Center: While running Origin, press F11 and search All Plot Types for Heatmap.
- Tutorial: Create Heatmap with Virtual Matrix and Colormap Bar Plot
- Blog Post: Heatmap with Labels
Keywords:heatmap, contour, virtual matrix, split heatmap