1.229 FAQ-996 How to connect data points within groups?
Last Update: 2/27/2019
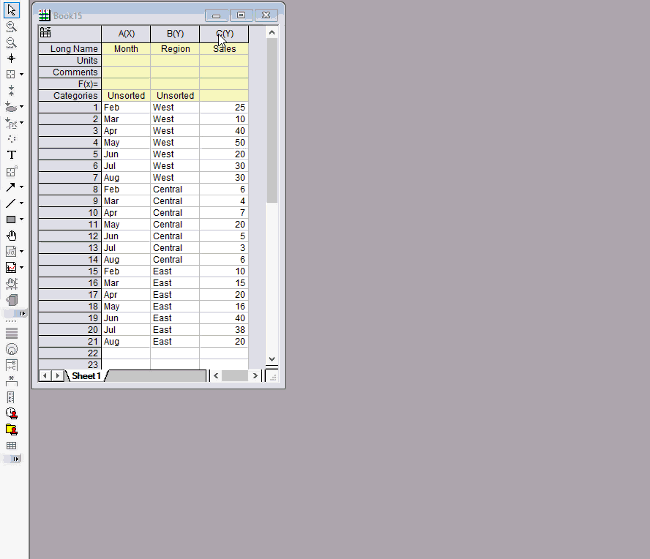
With Overlap Panels option of Trellis Plot, it is easy in Origin to connect data points within groups.
Keywords:categorical, between groups, symbol and line
- 1.219 FAQ-966 How to prevent the axis rescaling for 2D graphs?
- 1.220 FAQ-967 How to change system color lists?
- 1.221 FAQ-971 How to display 24:00 as 00:00 in tick label?
- 1.222 FAQ-972 Can I modify the tooltips that appear when I hover on data plots in my graph?
- 1.223 FAQ-984 Why can't I select graph objects by mouse clicking?
- 1.224 FAQ-985 Why does the export quality of graph with small size fail to be as good as the one of large size?
- 1.225 FAQ-986 How to remove line between two points on a Line+Symbol plot?
- 1.226 FAQ-991 How to add equations and special characters in Graph?
- 1.227 FAQ-992 How can I use a "real" minus sign to my axis tick labels?
- 1.228 FAQ-994 How to order column or bars in column or bar plot?
- 1.229 FAQ-996 How to connect data points within groups?
- 1.230 FAQ-997 How to change the shape of axis break?
- 1.231 FAQ-999 How to turn off the Common Display controls?
- 1.232 FAQ-1001 Origin Graphs copied to Excel do not update when changes are made in Origin
- 1.233 FAQ-1005 Why the exported graph size is much smaller than the page size set in Origin?
- 1.234 FAQ-1006 Why is it that data points, error bars and text labels lying on the layer frame are not clipped?
- 1.235 FAQ-1007 How do I label data points in a plot with text or numeric values from other columns?
- 1.236 FAQ-1010 How to create an implicit function plot?
- 1.237 FAQ-1015 How to customize Heatmap?
- 1.238 FAQ-1016 How do I do if the font size in the exported graph becomes small?
- 1.239 FAQ-1017 How to recover the deleted labels for a pie chart?