1.259 FAQ-1060 How to make my Column/Bar plot start from axis?
Last Update: 7/9/2020
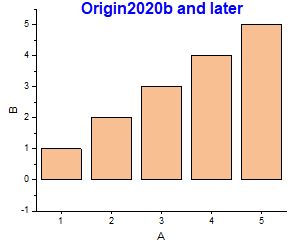
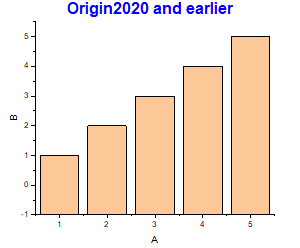
From Origin 2020b, column/bar chart grows up from additional line, no matter the line shows or not. The additional line is set to Y = 0 by default. If you choose not to show the line, column/bar chart will still use Y = 0 as baseline and grow up from it. This is different from the previous versions, in which columns/bars always start from X/Y axis.
|
|
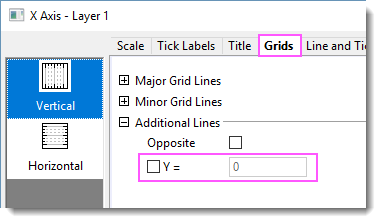
To plot columns/bar starting from axis like the previous versions,
- Set system variable @CBB = 0 by Preference: System Variables....
- Double click on the Y axis to open the Axis dialog. Activate Grid tab. Uncheck "Y=" under Additional Lines.
-
Keywords:bar, bottom line, bottom axis line, column, additional line, rise from zero