1.153 FAQ-801 How do I create an Arrhenius plot?
Last Update: 12/7/2025
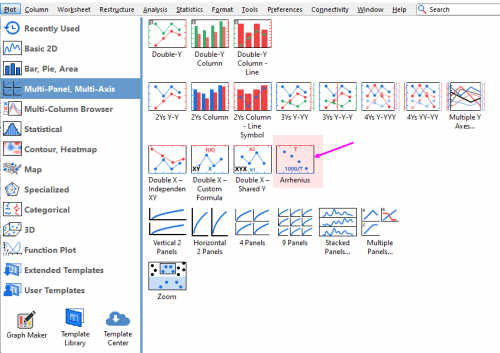
Starting with Origin 2026, use the built-in menu Plot > Multi-Panel, Multi-Axis: Arrhenius
Before Origin 2026, see detailed steps in this blog
Keywords:Arrhenius plot, Secondary X Axis
- 1.143 FAQ-758 How to generate grid directly from XYZ contour plot?
- 1.144 FAQ-759 How to create histogram with relative frequency?
- 1.145 FAQ-763 How to reduce unevenly spaced XYZ data?
- 1.146 FAQ-764 How to create a loosely separated 3D wire frame if your data points are dense?
- 1.147 FAQ-771 How to color data points in different regions with different colors?
- 1.148 FAQ-772 How do I create 3D Waterfall with line and scatter?
- 1.149 FAQ-773 How to plot the bounds of 90% confidence intervals in probability or Q-Q plot?
- 1.150 FAQ-776 How to edit annotations belong to same plot or plots in same group?
- 1.151 FAQ-779 How to create a 2D nested function plot?
- 1.152 FAQ-795 How do I export graphs as EPS or PDF file with editable text?
- 1.153 FAQ-801 How do I create an Arrhenius plot?
- 1.154 FAQ-803 When I print a graph with overlapped layers, the layer are not aligned correctly. How can I solve it?
- 1.155 FAQ-804 How to troubleshoot exporting EPS/PDF problems
- 1.156 FAQ-807 How can I customize line segments in a Line Series plot?
- 1.157 FAQ-813 How to show X Error option in Plot Setup dialog?
- 1.158 FAQ-814 When I create a PDF from MS Word, the data extend beyond the axes of my Origin graph.
- 1.159 FAQ-816 How do I insert graphs as new slides in my currently opened PowerPoint presentation?
- 1.160 FAQ-817 How do I add drop lines to a 2D line plot?
- 1.161 FAQ-818 Why are dashed lines not working in my line + symbol plot?
- 1.162 FAQ-821 How can I replace/insert a layer in a stacked graph?
- 1.163 FAQ-822 Why do my contour and surface plots from XYZ data look different in version 2016 and higher?