Hinweis:Dieser Abschnitt ist nur in englischer Sprache verfügbar. Wir bitten um Ihr Verständnis.
1.205 FAQ-947 How to add trendline or smoothed line for a 2D scatter plot?
Last Update: 3/18/2021
If you have a 2D scatter plot, and want to add a trendline or a smoothed line on it, you can
- Click on the plot and select Add Fitted Curves' button from mini toolbar. Select Linear Fit Curve from the drop-down.
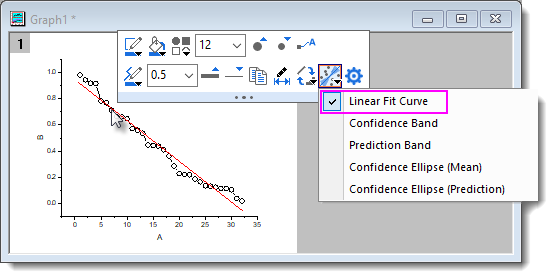
OR,
- Use the App 2D Smoother. Please note, we have also had an App 3D Smoother which can be used to smooth 3D data from XYZ columns or a matrix.
If you want to add smoothed line to a 2D scatter plot, you can also
Keywords:trendline, smoothed line, smoothing