31.13.24 X, Y, X, Y Vector Graph
Data Requirements
Select two X columns and two Y columns (or a range from these columns).
Creating the Graph
Select required data.
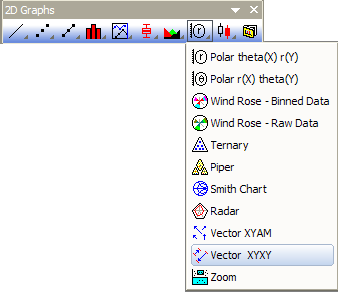
Select
or
Click the Vector XYXY button on the 2D Graphs toolbar.
Template
VECTXYXY.OTP (installed to the Origin program folder).
Notes
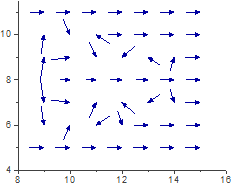
The Vector plot is also called as Quiver plot.
The leftmost X and Y columns determine the XY coordinate of the tail of the vector. The second set of X and Y columns determine XY coordinate of the head of the vector.