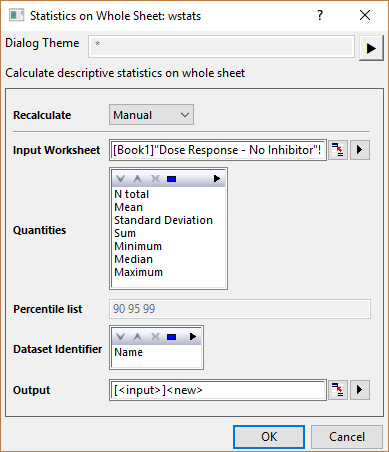
See Recalculating Analysis Results for details of the recalculation options.
Specify the input worksheet. See here of details of how to specify input data range.
Specify the quantities to be calculated for each column, respectively.  is the
  th sample.
| N Total |
Total number of data points, denoted by n |
|---|---|
| Mean |
The mean (average) score
|
| Standard Deviation |
where |
| Sum |  . If there is no WEIGHT variable, the formula reduces to . If there is no WEIGHT variable, the formula reduces to  . .
|
| Minimum |
|
| Median |
Median or second (50%) quantile, Q2. See Interpolation of quantiles for Statistics on Columns dialog box for computational methods |
| Maximum |
|
Percentile list displays the percentile values fixed as "90 95 99".
Multiple identifier(s) can be inserted into the output summary table to show the source datasets information. You can add, remove, order identifiers via controlling buttons: Move Up button ![]() , Move Down button
, Move Down button ![]() , Remove button
, Remove button ![]() , Select All button
, Select All button ![]() , Select button
, Select button ![]() in toolbar
in toolbar  .
.
Each type of identifiers will be add as a column in the summary worksheet. Options are:
| Range | Use the range syntax. |
|---|---|
| Book Name | Use the workbook long name. |
| Sheet Name | Use the worksheet name. |
| Name | Use the long name of the corresponding column if there is a long name, otherwise use the short name of column. |
| Short Name | Use the short name of the corresponding column. |
| Long Name | Use the long name of the corresponding column. |
Specify where to output the report worksheet
 . If there is no WEIGHT variable, the formula reduces to
  .
.
^2/d}")

}\,")
}\,")