8.12 Working with Maps
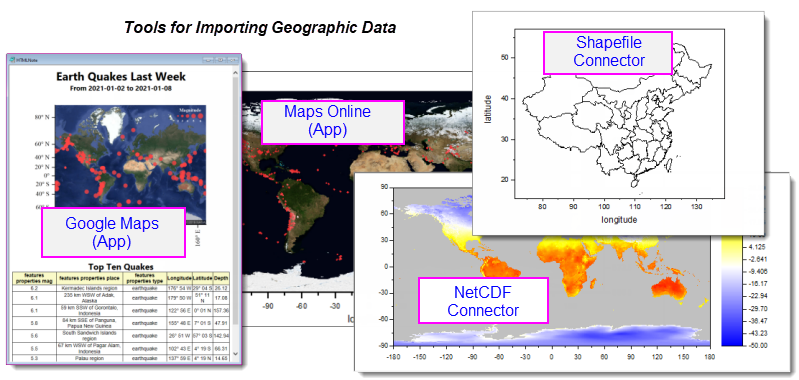
There are several ways to import geographic data into Origin. If you work with NetCDF files, Origin's NetCDF Connector is a good place to start. There is also a Shapefile Connector for direct import of shapefile data.
Additionally, OriginLab makes available, two cost-free Apps that allow you to download map data to use as a base map for scatter plots, bubble-charts and the like.
Contents
Data: Connect to File: NetCDF
OriginLab added significant support for import and analysis of NetCDF files to Origin 2021b.
- An overview of NetCDF, including basic data import is covered in Connecting to File > NetCDF.
- More in-depth information regarding graphing, analysis and export of NetCDF data is provided here.
Additional Resources:
- Origin Blog: NetCDF
- YouTube: NetCDF Videos.
Data: Connect to File: Shapefile
- Origin's Shapefile Connector is pre-installed to your Origin software (2021b or later). Information on Origin's Shapefile Connector can be found on the OriginLab File Exchange.
- Basic information on importing using Origin's Shapefile Connector, can be found in the Origin Help file.
Additional Resources:
- Origin Blog: Adding Maps to Graphs with Built-In and Imported Shapefiles.
- YouTube: Shapefile-based ROIs for NetCDF Data in Origin.
Maps Online (App)
Origin's Maps Online App is a free add-on available from the OriginLab File Exchange; or by opening the App Center (F10) and searching on "maps".
This is an older App but it remains useful for adding a base map image to an Origin graph window. Users can then overlay a scatter plot, bubble plot or other plot type, on the base map.
Additional Resources:
- Origin Blog: Maps Online
- YouTube: Maps Online App
- Tutorial: Connect to Web Data by Copy Link Address.
Google Map Import (App)
Origin's Google Map Import App is another free add-on available from the OriginLab File Exchange; or by opening the App Center (F10) and searching on "maps".
Like Maps Online, this App predates the more powerful NetCDF and Shapefile import Connectors but, it is another way to easily add a base map to an Origin graph window. This App uses the popular Google Maps database, allowing you to reliably add consistent-looking base maps for any place on earth. As with Maps Online, the user can then overlay scatter plots, bubble maps, etc.
Additional Resources:
- Origin Blog: Google Maps blog posts.
- YouTube: Google Map Import App
- Tutorial: Add Google Map to Origin Graph
Adding Boundary Information to Maps
There are several ways you can add map outlines to your graphs:
- You can inset map boundaries from the Insert menu: This is likely the easiest option. If you
- You can use the Shapefile Connector.
- You can use the Import Shapefile App.
With the Insert Menu
When the following conditions are met, you can insert map boundaries to your Contour or Image Plot:
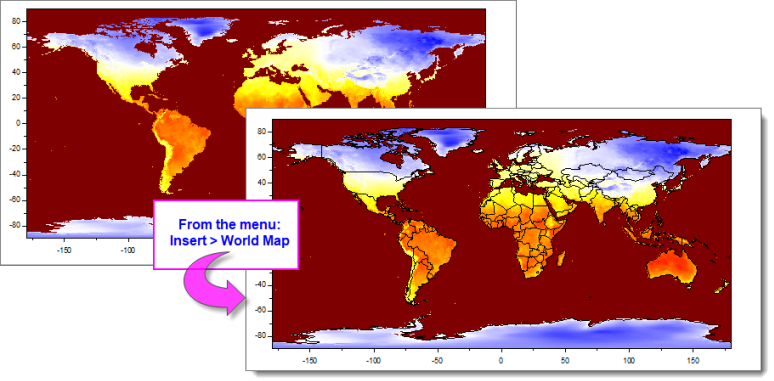
- The graph layer must be use 2D (XY) scales. The Layout Page is not supported.
- The XY scale must conform to scales used in the <Origin Program>\Samples\Map Data.opju file installed with your Origin software: X scales should fall within -180 to 180 (0 - 360 will not work); Y scales should be -90 to 90.
- Individual country maps cannot be applied to a portion of the country (i.e. you cannot scale in to the US Midwestern States and apply the Continental USA Map boundaries. Apply the map boundaries first, then scale in.
Additional Resources:
map folder and legend entry
In Origin 2022b, inserting map boundaries simultaneously added (1) a visible "Map Data" folder to the root project folder and (2) a line plot legend entry for the boundaries (e.g. "World"). Both were hidden for Origin 2023. Roll back to the previous behavior by setting the value of these system variables = 1 (e.g. @MDF=1).
In addition, you can access the hidden map boundary worksheet in one of two ways:
- After inserting the boundaries, go to Object Manager and in Show Plots mode, click on the line plot for inserted boundaries and use the Mini Toolbar Go to Source Sheet button.
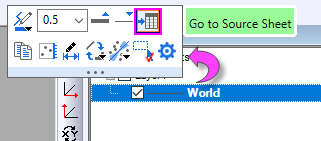
or
- Using the LabTalk window -os command.
With the Shapefile Connector
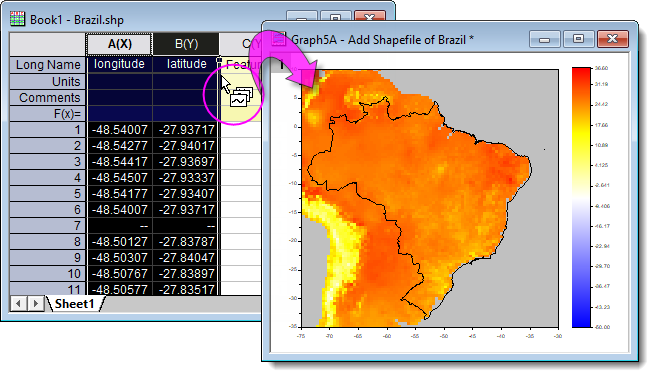
If a particular map is not available from the Insert menu, you can use the Shapefile Connector to import polygon data and add it to an existing contour or image plot.
- Click Data: Connect to File: Shapefile and import your .shp file.
- Select XY columns (Lon/Lat), hover near the right edge of your selection and and drag it to the graph window.
Additional Resources:
With Import Shapefile (App)
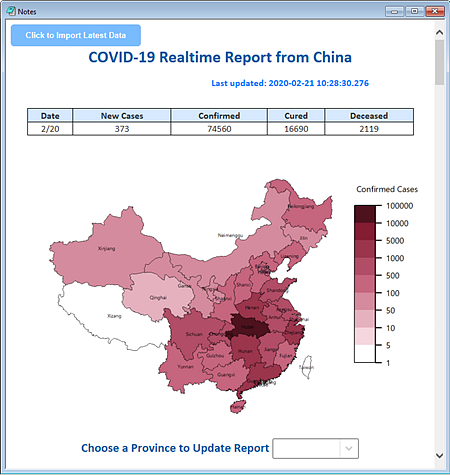
The Import Shapefile App predates the Shapefile Connector and would not be recommended at all but for the fact that it works with another free Origin App -- Colormap for Map Data -- to add a colormap to shapefile polygons (as of version 2021b, the Shapefile Connector does not work with the Colormap App).
Additional Resources
- Origin Blog: COVID-19 Real Time Report from China.
- Origin Blog: Summarizing 2016 Presidential Election Results using Origin Apps.
- Origin Blog: Colormap with Specified Values for Map Data Plot.