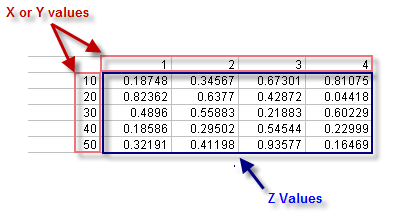
Spreadsheet users will be familiar with the following type of data arrangement in which you have either:
In the Origin matrix, columns are mapped to linearly-spaced X values; rows are mapped to linearly-spaced Y values. If your worksheet contains linearly-spaced X or Y coordinate values arranged in a fashion similar to the above figure, and you would like to move the data into an Origin matrix, you can do a direct worksheet to matrix conversion of your data (no gridding is performed), extract the Z values and write them to the matrix according to one of seven configurations.
To perform a direct worksheet to matrix conversion of your data:
| Recalculate |
Controls recalculation of results
For more information, see: Recalculating Analysis Results |
|---|---|
| Input Worksheet |
The data input range. For help with range controls, see: Specifying Your Input Data |
| Data Format |
The format of the source data:
|
| X Values in |
Location of X values. Available when Data Format = X across columns.
|
| Y Values in |
Location of Y values. Available when Data Format = Y across columns.
|
| Y Value in First Column |
Check to use the first column values as matrix Y value. |
| X Value in First Column |
Check to use the first column values as matrix X value. |
| Even Spacing Tolerance |
Tolerance to check even spacing. |
| Use Linear Fit Estimate for Coordinates |
Check to use Linear Fit Estimate for Coordinates |
| Trim Missing |
Determine whether to trim the missing rows or columns. Notes: Selecting the Trim Missing box will drop the entire row or column if it contains missing values. X, Y coordinates in Origin Matrix should be even spacing, Even Spacing Tolerance is used to set the tolerance to check even spacing. There can be no rows above the data to convert and no columns to the left of the data to convert. |
| Output |
Specify three columns for the output XYZ range. X, Y and Z data can be output to different sheets and books. For help with the range controls, see: Output Results |