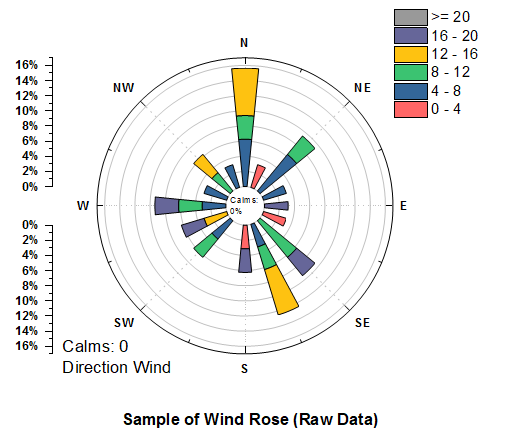
31.13.22 Wind Rose-Raw Data
Contents
Data Requirements
Select one Y column (or a range from one Y column). The X column displays the wind direction, and the Y columns contain the wind speed values. If there is an associated X column, X column supplies X values; otherwise, sampling interval of the Y column or row number is used.
Creating the Graph
- Select required data.
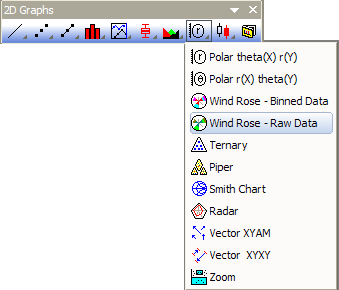
- From the menu, choose .
- or
- Click the Wind Rose-Raw Data button on the 2D Graphs toolbar.
- Then the dialog of the plot_windrose X-Function opens, allowing you to specify the options for creating the graph.
- Click OK in the dialog to create the graph.
The dialog of the plot_windrose X-Function
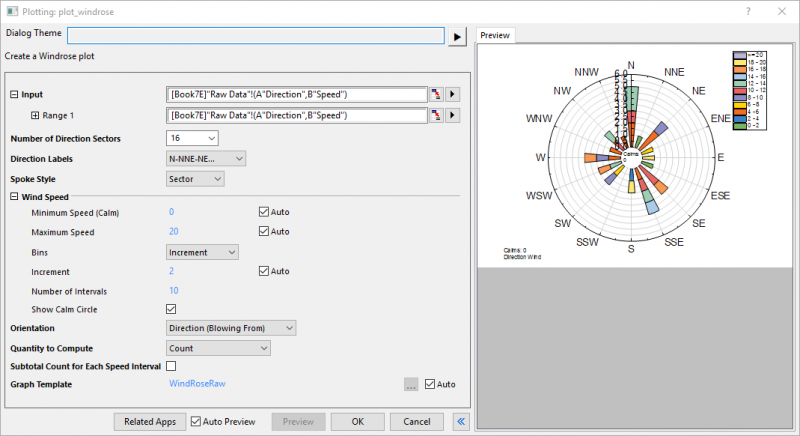
| Input |
Specify the input data range.
|
|---|---|
| Number of Direction Sectors |
The direction data will be divided into sectors and the counts of data points that fall into each sector will be used to create the windrose plot. You can select or enter the number of sectors for direction data here. Note: There are 8 selectable values under the dropdown list: 4, 8, 12, 16, 18, 24, 32 and 36. You can also enter an integer in this combo box. |
| Direction Labels |
Specify the direction labels which will be shown on the windrose plot.
|
| Spoke Style |
Specify the style of spoke
|
| Wind Speed |
Specify the settings for wind speed binning.
|
| Show Calm Circle | Specify whether to show the calm circle in the plot. By default, the calm circle is center at 15% of radial scale. You can define this value at Radial Axis dialog after the plot is created. |
| Orientation |
Specify the orientation of the wind directions.
|
| Quantity to Compute |
Specify what to calculate for each bin.
|
| Subtotal Count for Each Speed Interval |
Specify whether or not to output subtotal count/percent frequency for each speed interval. When the Quantity to Compute is Count, subtotal count will be outputted; otherwise, percent frequency will be outputted. |
| Graph Template |
By default, the built-in template "WindRoseRaw" will be selected with Auto box checked. You can uncheck Auto box to specify a user template to plot the graph. |
Clicking Related Apps button will open App Center with related apps listed.
Template
WindRose.OTP (installed to the Origin program folder).
Notes
- When you plot the Wind Rose from raw data, a worksheet named WindRose is added to the source workbook. It stores the binned data from which the Wind Rose is plotted. For more information about the 2D binning algorithm, please refer to The TwoDBinning.
- The "calms" (wind speed records that are 0) is counted separately during the binning and the result is listed in the last column in the WindRose sheet.
Version Information
| Minimum Version: Origin 8.1 | Last Update: Origin 2026 |