29.4.2 Western Blot
Contents
Support Information
To Analyze Western Blot Assays
- Using a template
- Select menu Help: Startup Dialog to open the Startup dialog
- Go to the Lab Assays tab, expand the Western Blot branch, and choose the desired data structure. A template will open with guidance.
- Using your own worksheet
- Enter your data in a worksheet,
- Select menu Statistics: Lab Assays: Western Blot to open the analysis dialog
Western Blot Data Structure
Western Blot with Raw Band Instensity
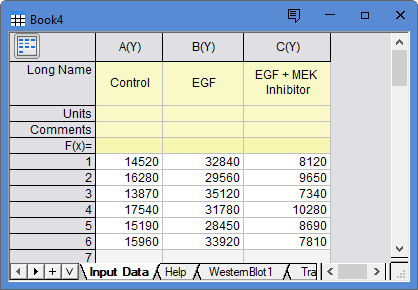
The target intensity values for different treatments to be analyzed.
- Each column is one experimental group, such as Control, TreatmentA, or TreatmentB.
- Each row is one independent biological replicate. At least 3 replicates are typically required. If technical replicates were measured, they should be averaged or otherwise summarized to one value per biological sample before entered here.
- This workflow does NOT verify whether the values have already been normalized to a reference. If reference normalization is required, normalize before import, or use the "Reference/Total Protein" workflow.
- All columns must contain numeric values. Text, empty cells, or negative gray values are handled as missing and excluded from analysis.
Western Blot with Reference/Total Protein
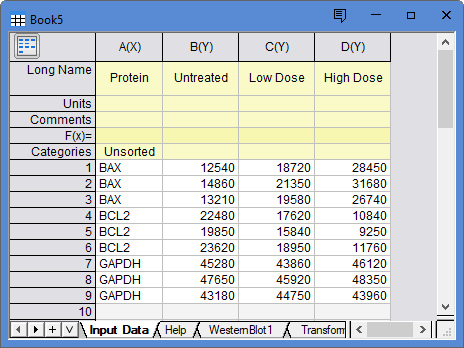
The protein types and their band intensity values to be analyzed. All target and reference proteins are stacked in one column.
- A text column Protein contains the labels of different protein types, such as GAPDH, ACTB, BAX, and BCL2. Each target protein replicate must correspond row-by-row to the reference protein replicate within the same experimental group. The row order of target and reference proteins must be consistent across all group columns. For example, if rows 1–3 are BAX replicates, rows 4–6 BCL2, and rows 7–9 GAPDH, then the first target replicate in each group should pair with the first GAPDH replicate, and so on.
- Beside Protein, all numeric columns contain target and reference intensity values in different experimental groups, such as Control, TreatmentA, or TreatmentB.
- Each row is one independent biological replicate. At least 3 replicates are typically required. If technical replicates were measured, they should be averaged or otherwise summarized to one value per biological sample before entered here.
Wetern Blot Dialog Box
Input
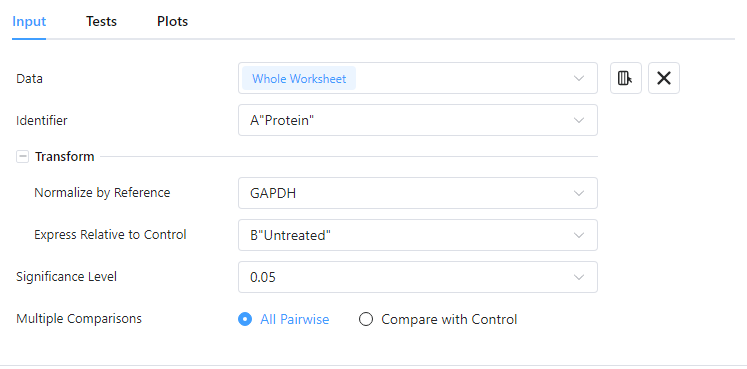
| Input | The band intensity values to be analyzed. |
|---|---|
| Identifier | For the "Reference/Total Protein" workflow, select the Protein column, which identifies whether each row is a target or reference protein. |
| Transform | Transformations are applied before statistical tests.
|
| Significance Level | Set the threshold to judge statistical significance. |
| Multiple Comparisons | Choose the comparison set.
|
Tests
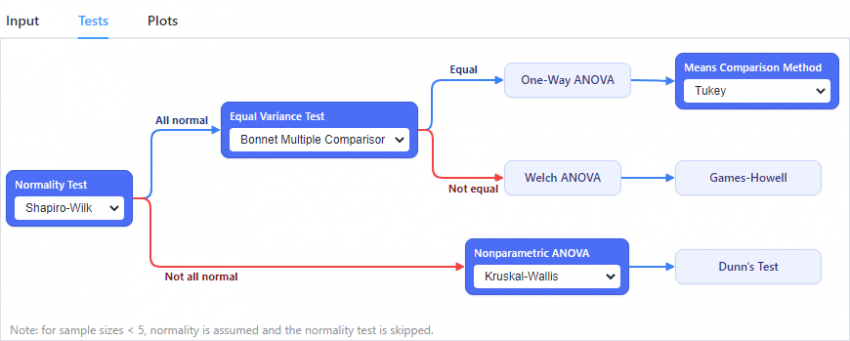
Step 1: Normality Test
Verify each group follows a Normal distribution or not. If number of replicates < 5, normality is assumed and this test is skipped.
- Shapiro-Wilk: default to small sample size (e.ge. 3 - 10 replicates).
- Anderson-Darling or D'Agostino-Pearson K2: useful for larger samples; may flag slight deviations as significant.
- Kolmogorov-Smirnov: less preferred fro small samples or tied gray-scale values.
Step 2: Equal Variance Test (parametric branch only)
If all groups are normal, Equal Variance Test is performed to test whether all groups' variances are equal. See algorithm here.
- Bonett Multiple Comparison
- Brown-Forsythe: a safe default to small sample size because it is more robust against non-normality (especially when sample size < 5) and outliers.
- Levene ||
- Levene ()2
- Bartlett: may be appropriate when normality is well supported, but less robust in small or noisy samples.
- If all groups' variances are equal, One-Way ANOVA + Means Comparison is performed.
- If not equal, Welch ANOVA + Games-Howell is performed.
Step 3: Nonparametric branch
If one or more groups are not normally distributed, Nonparametric ANOVA + Dunn's Test is performed.
Plots
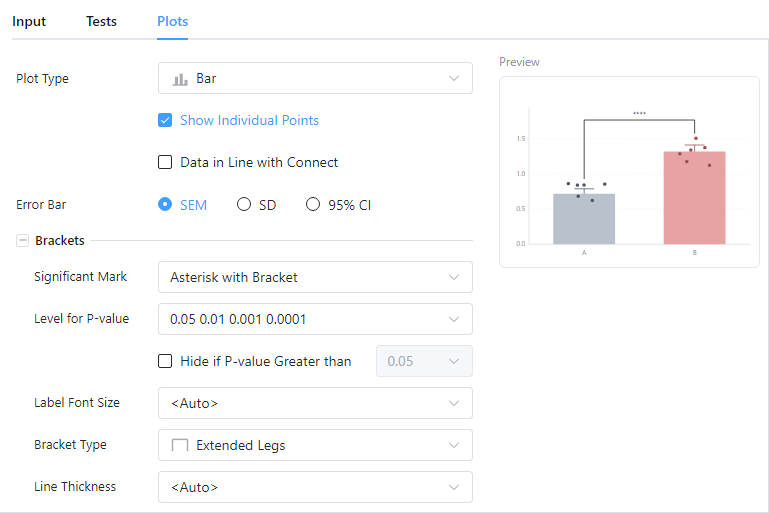
Controls the appearance of the mulitple comparison plot. Every change is reflected in the live preview panel on the right.