29.15.9 3D Wall Graph
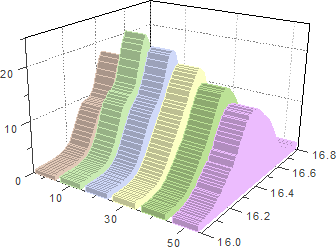
Wall-Graph
Data Requirements
Select at least one Y column (or a range from at least one Y column). Ideally, select at least two Y columns (or a range of at least two Y columns). If there is an associated X column, X column supplies X values; otherwise, sampling interval of the Y column or row number is used.
Creating the Graph
From the menu, choose .
or
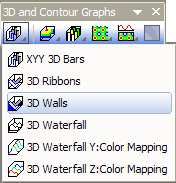
Click the 3D Walls button on the 3D and Contour Graphs toolbar.
Template
- glWalls.OTP (OpenGL)
- WALLS.OTP
(Installed to the Origin program folder)
Notes
- The Y value of each data point is represented as the height of a wall. Each wall has a fixed width, and is labeled with its worksheet column name on the Z axis.
- Beginning with Origin 2018, you can add lighting effects to the 3D Wall graph by selecting the Add lighting effects... check box on the Plot Details Pattern tab (Format: Plot). To open the associated Lighting dialog, click the Lighting Control Dialog button
 in the Styles toolbar.