29.9.27 Violin Plot
Violin-Plot
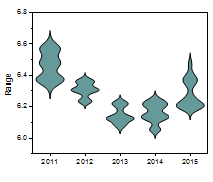
| Violin Plot
|
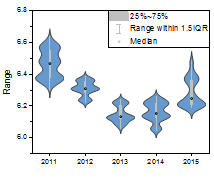
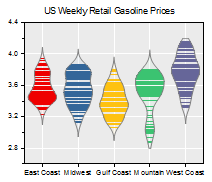
Violin with Box
|
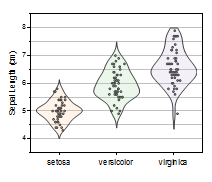
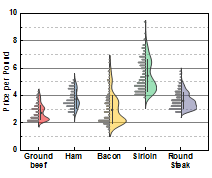
Violin with Point
|
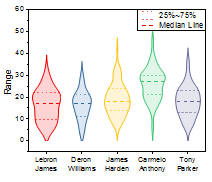
Violin with Quartile
|
|
|
|
|
| Violin with Stick
|
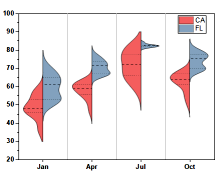
Split Violin
|
Half Violin
|
|
|
|
|
|
Data Requirements
You need to have one or more worksheet columns to create such graph, except Split Violin.
For Split Violin, you need to select at least two columns, and last column should be contains 2 categories only.
Creating the Graph
Violin Plot
- Select required data.
- From the menu, select .
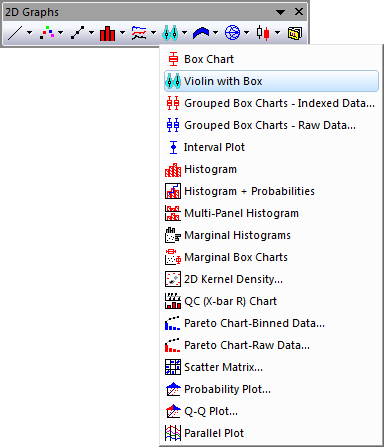
Violin with Box
- Select required data.
- From the menu, select .
- or
- Click the Violin with Box button on the 2D Graphs toolbar.
Violin with Point
- Select required data.
- From the menu, select .
Violin with Quartile
- Select required data.
- From the menu, select .
Violin with Stick
- Select required data.
- From the menu, select .
Split Violin
- Select required data.
- From the menu, select .
Half Violin
- Select required data.
- From the menu, select .
Template
Violin Plot: Violin.otpu
Violin with Box: ViolinBox.otpu
Violin with Point: ViolinData.otpu
Violin with Quartile: ViolinQuartile.otpu
Violin with Stick: ViolinStick.otpu
Split Violin: ViolinSplit.otpu
Half Violin: HalfViolin.otpu
Notes
- Each Y column of data is represented as a separate Violin plot. The column names or labels supply the X axis tick labels.