You can create profile plots from matrix data or from worksheet data that are arranged in a virtual matrix. Once you have created apProfile plot, you can generate cross-sectional profiles of your plot, along vertical lines, horizontal lines or arbitrarily-placed lines:
| Note: Your Profile plot may display a "Speed Mode is On" message. This indicates that your data were selectively plotted. You can modify or disable Speed Mode settings. See, Speed Mode, Skip Points if Needed. |
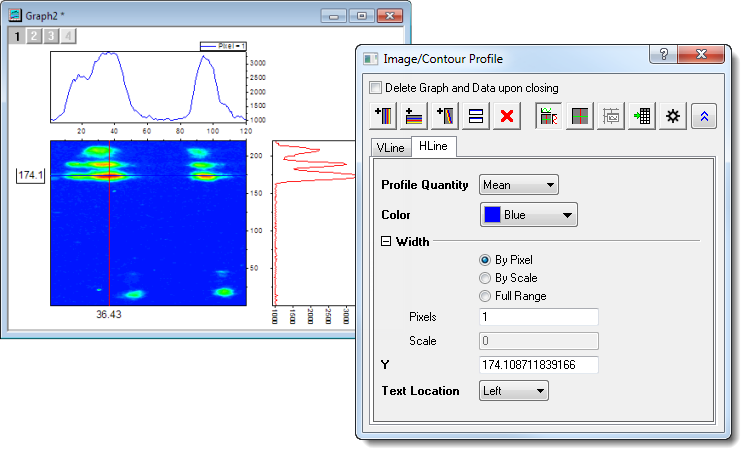
The Image/Contour Profile dialog box opens when the Profile plot is created:
 button in the upper-right corner of the Profile graph page.
|
Specify whether to delete the profile graphs and data after the Image Profile dialog is closed. |
|---|---|
| |
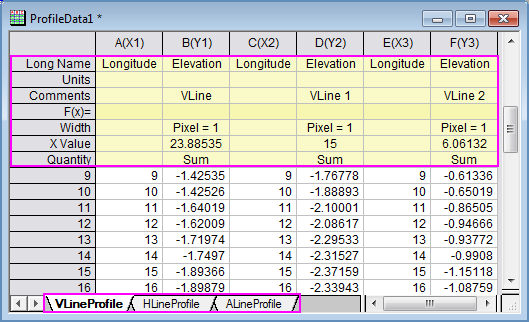
Add a vertical profile line. Vertical profile lines are added to the graph layer to the right of the source plot. |
| |
Add a horizontal profile line. Horizontal profile lines are added to the graph layer above the source plot. |
| |
Add an arbitrary profile line. Arbitrary profile lines are added to the graph layer above and to the right of the source plot. |
| |
Places a movable, duplicate line at the position of the active profile. |
| |
Deletes the active profile. If the profile is the only one in the layer, the layer is simultaneously hidden (see below). |
| |
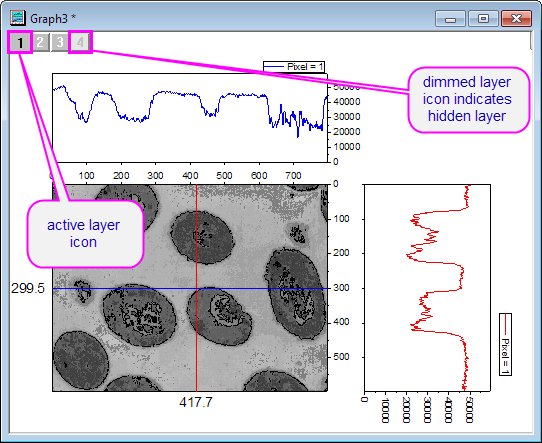
Arrange the profile plots and the source plot in a composite graph. Layers without data are not shown this mode. |
| |
A toggle that Extracts the profile plots to separate graph windows or recombines plots into a single composite. |
| |
This button is enabled only when the profile plots are plotted to separate graphs. When this button is clicked, the profile graph that corresponds to the active tab will become active. |
| |
Go to the profile dataset of the active tab. |
| |
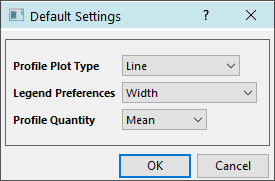
This button opens the Default Settings dialog.
|
| |
Show VLine, HLine and ALine tab controls (see next). |
Tab controls differ slightly for matrix data and virtual matrix (worksheet) data. Differences are noted in the table.
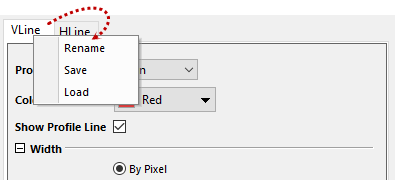
Right-click on the tab title to rename the tab, save the detailed line settings for future use, and load the pre-saved line settings for different graph window.
Customize current profile line.
| Profile Quantity |
Choose a quantity to plot. When you are plotting along a single pixel (see Width setting, below), these values have no meaning (i.e Min=Max=Mean, etc). When you are profiling with a range of values, this setting will determine which quantity is plotted within the profiled range. For example, you are profiling along VLine and you have set Width to By Scale and set scale to 20. This will place two vertical lines, centered at X and located at a distance of 20 scale units apart. The Profile Quantity will then be measured across the 20 scale units (between the two vertical lines), at the chosen X value.
|
|---|---|
| Output Profile Data |
Only available when source data is from a virtual matrix.
|
| Color |
Specify the color of profile lines. |
| Show Profile Line |
Specify whether to show the profile line. |
| Width |
Specify the width of sample profile.
|
| X |
Specify the position of the profile. This is available only when the profile is a vertical one and Full Range is not selected. |
| Y |
Specify the position of the profile. This is available only when the profile is a horizontal one and Full Range is not selected. |
| X1, Y1, X2, Y2 |
These controls are available only when the profile is an arbitrary one. They control the position and length of the arbitrary profile. X1 and Y1 determines the X and Y location of one end of the line while X2 and Y2 determines the location of the other end. |
| Text Location |
A text label is displayed on the axis to show the position of the profile. Using the drop-down list, you can specify the position of this text label. Available options:
|
When you delete all profile lines from the layer using the Delete Active Profile ![]() button on the Image/Contour Profile, the layer is hidden (but not deleted).
button on the Image/Contour Profile, the layer is hidden (but not deleted).
| Note: You can only hide the layer by deleting profiles with the Delete Active Profile |
") 1/2, where
1/2, where  and
and  are the projections of the lateral width along the X and Y axes, with respect to existing axis scales.