Select at least one Y column of values (or a range from at least one column). Ideally, select at least two Y columns of values (or a range of at least two Y columns). If there is any associated X column, X column supplies X values; otherwise, sampling interval of the Y column or row number is used.
Please note, the number of X columns should not be more than two for this 2 panels graph:
Select required data.
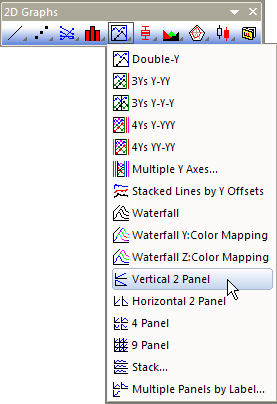
From the menu, choose .
or
Click the Vertical 2 Panel button on the 2D Graphs toolbar.
PAN2VERT.OTP (installed to the Origin program folder).
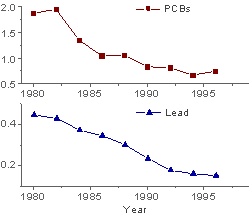
Each column of Y values plots into a separate layer. The two layers are arranged in one column and two rows.